The latest enterprise AI insights

Industry

Arrow Down Icon Svg

Resource Type

Arrow Down Icon Svg
Thank you! Your submission has been received!
Oops! Something went wrong while submitting the form.

7.13.2023

Case study

Saving millions in yield and productivity improvements with SymphonyAI

Industrial

7.13.2023

Case study

Standardize global operations with SymphonyAI

Industrial

7.13.2023

Case study

Digital Intelligence - Seagate Success Story

Industrial

7.13.2023

Blog

The FAST Slow-Down: Four Factors Behind FAST’s Sluggish Revenue

Abstract digital art resembling a fragmented, colorful mosaic tunnel or vortex with small rectangular blocks in bright colors like blue, red, yellow, and purple on a dark background.

Media

7.10.2023

Blog

Holistic customer risk assessment: bridging the operational gaps in financial institutions

Person in a business suit using a tablet and laptop on a desk with sticky notes, pens, and phone, with illustrated glowing network connection lines overlayed linking points above the devices.

Financial Services

7.6.2023

Blog

How MVPDs Can Compete with Streaming Services Through Automation and Innovation

Close-up view of a gray concrete building facade showing diagonal shadows cast on vertical and horizontal structural elements.

Media

6.30.2023

Byline

AI-Powered Store Intelligence Shines a Light on Shrink

Blurred image of a supermarket aisle with shelves of products, overlaid with a white network of interconnected spheres and lines, and a circular inset photo of a smiling woman with blonde hair in a white turtleneck on a red background in the lower left corner.

Retail / CPG

6.28.2023

Video

SymphonyAI Media Overview

Purple digital background with white text reading: An Overview of SymphonyAI Media by CEO Mark Moeder, with SymphonyAI Media logo in the top right corner.

Media

6.28.2023

Byline

Integrate AI-driven financial crime solutions today to defend against the AI-generated schemes of tomorrow

Digital abstract graph with two fluctuating lines, one solid green and one dashed orange with circular markers, over a dark blue background with light blue dots forming a globe shape and a glowing light effect in the top left corner.

Financial Services

6.27.2023

Video

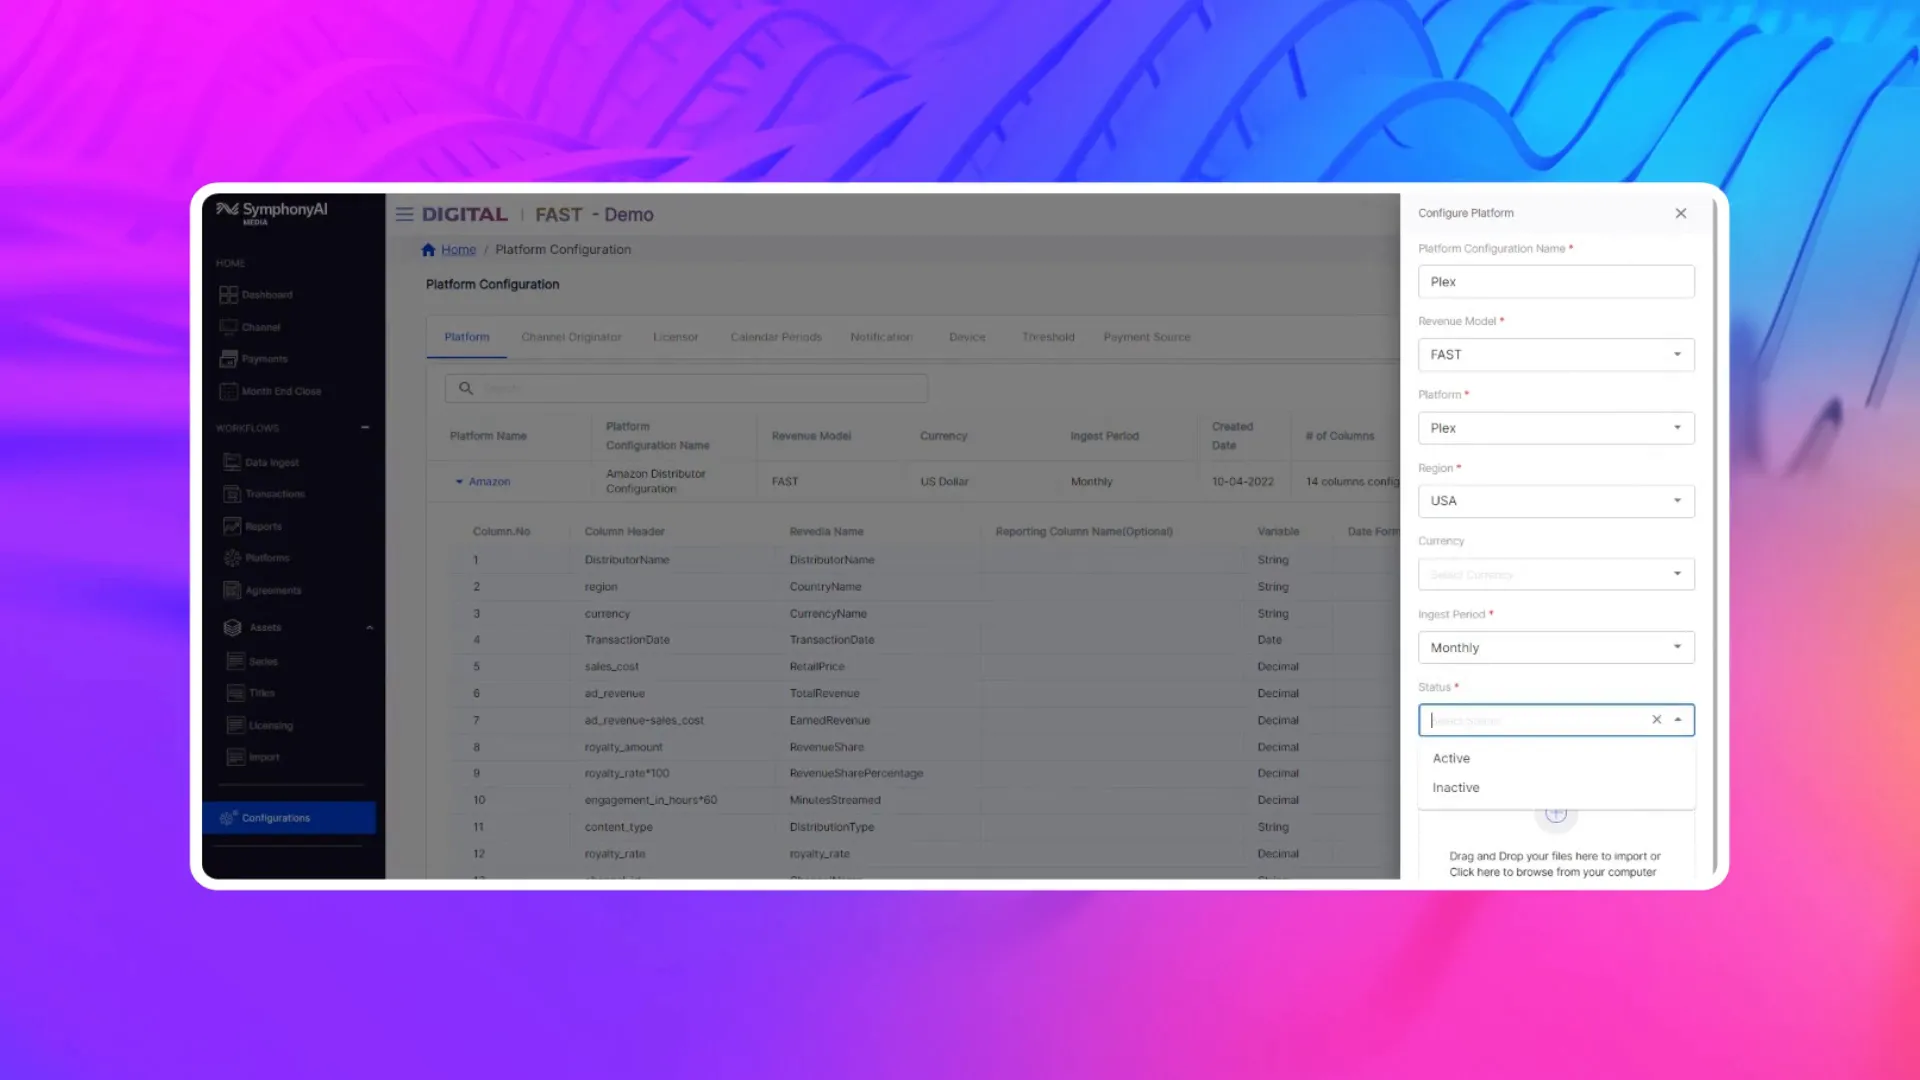
Revedia Tutorial: FAST Platform Configuration

User interface of SymphonyAI Media's FAST platform configuration screen showing platform setup details such as platform name, revenue model, currency, ingest period, and status with options to configure and import files.

Media

6.27.2023

White paper

Improve retail store execution fast

Retail / CPG

6.26.2023

Video

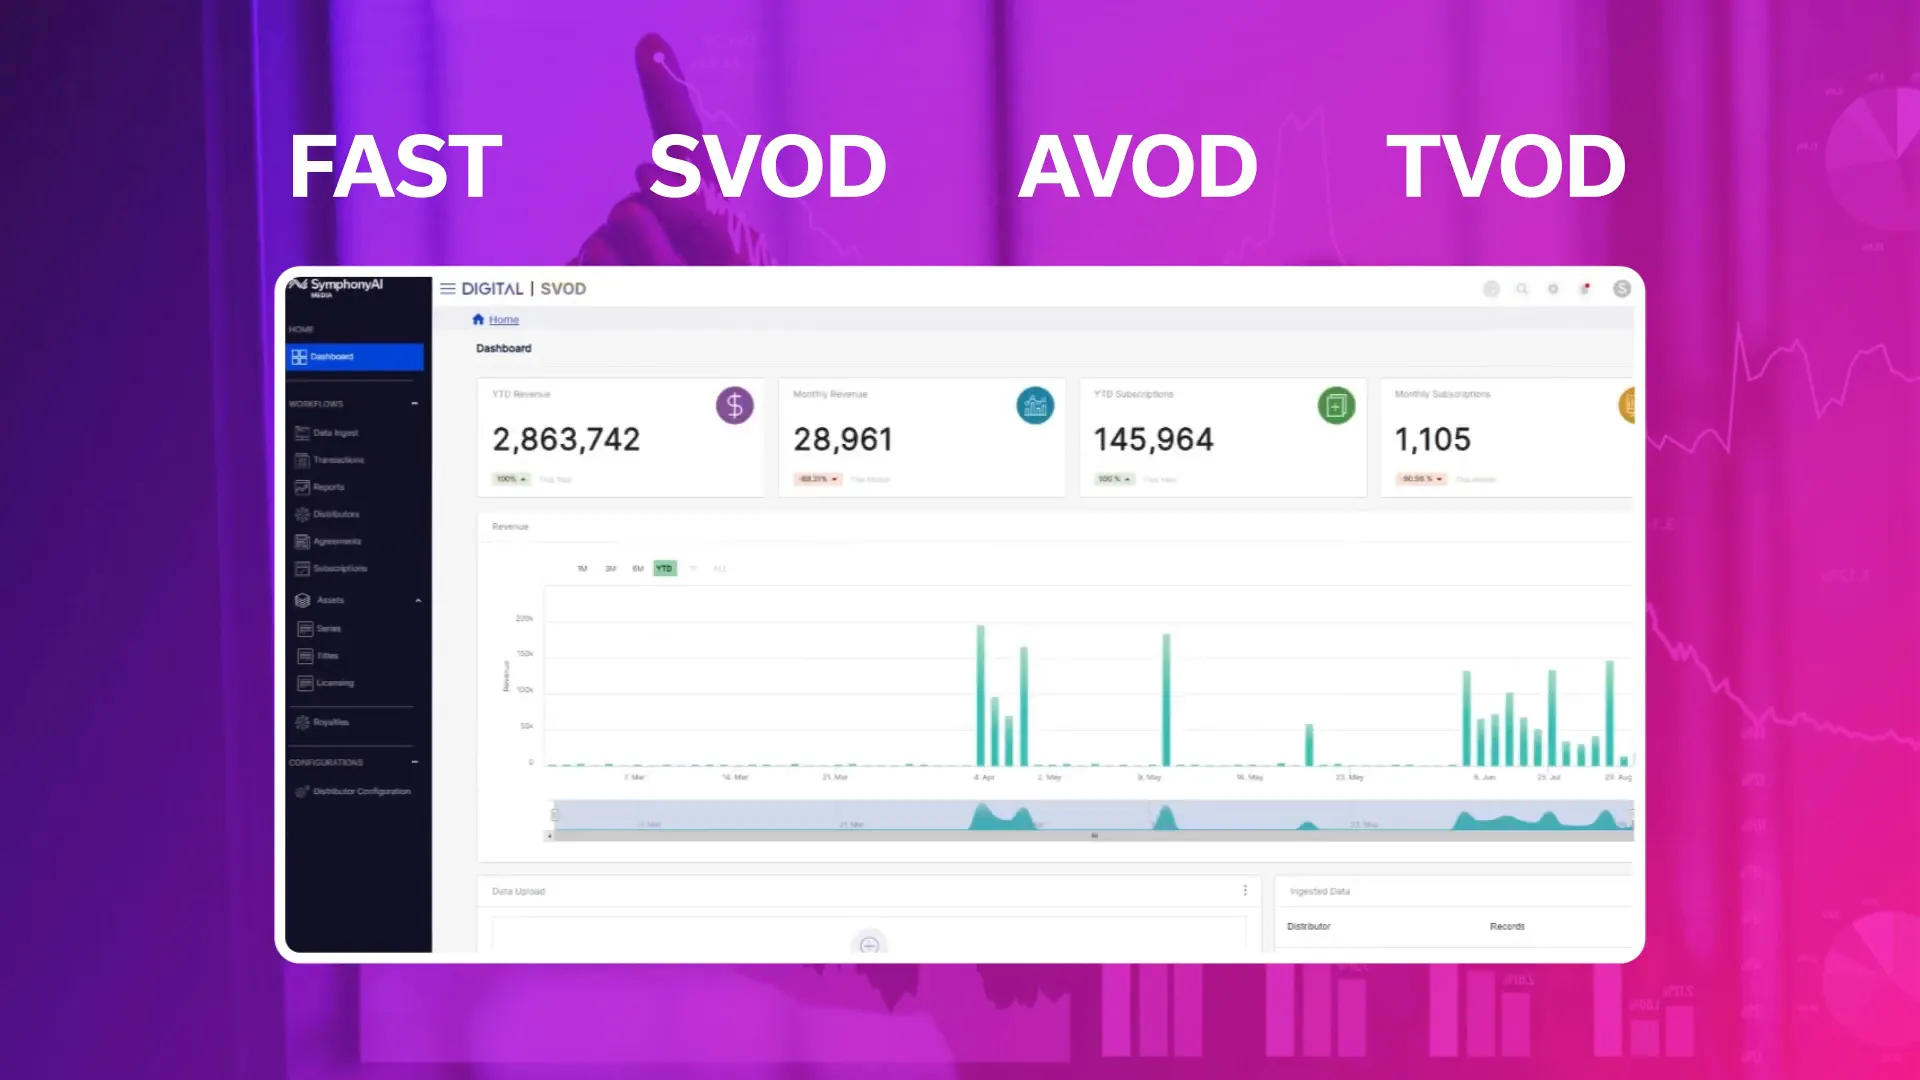
Revedia Tutorial: Data Ingest

Dashboard interface on a digital media platform with year-to-date revenue of 2,863,742, monthly revenue of 28,961, year-to-date subscriptions of 145,964, and monthly subscriptions of 1,105, overlaid on a purple background with large white text showing FAST, SVOD, AVOD, and TVOD.

Media

6.25.2023

Video

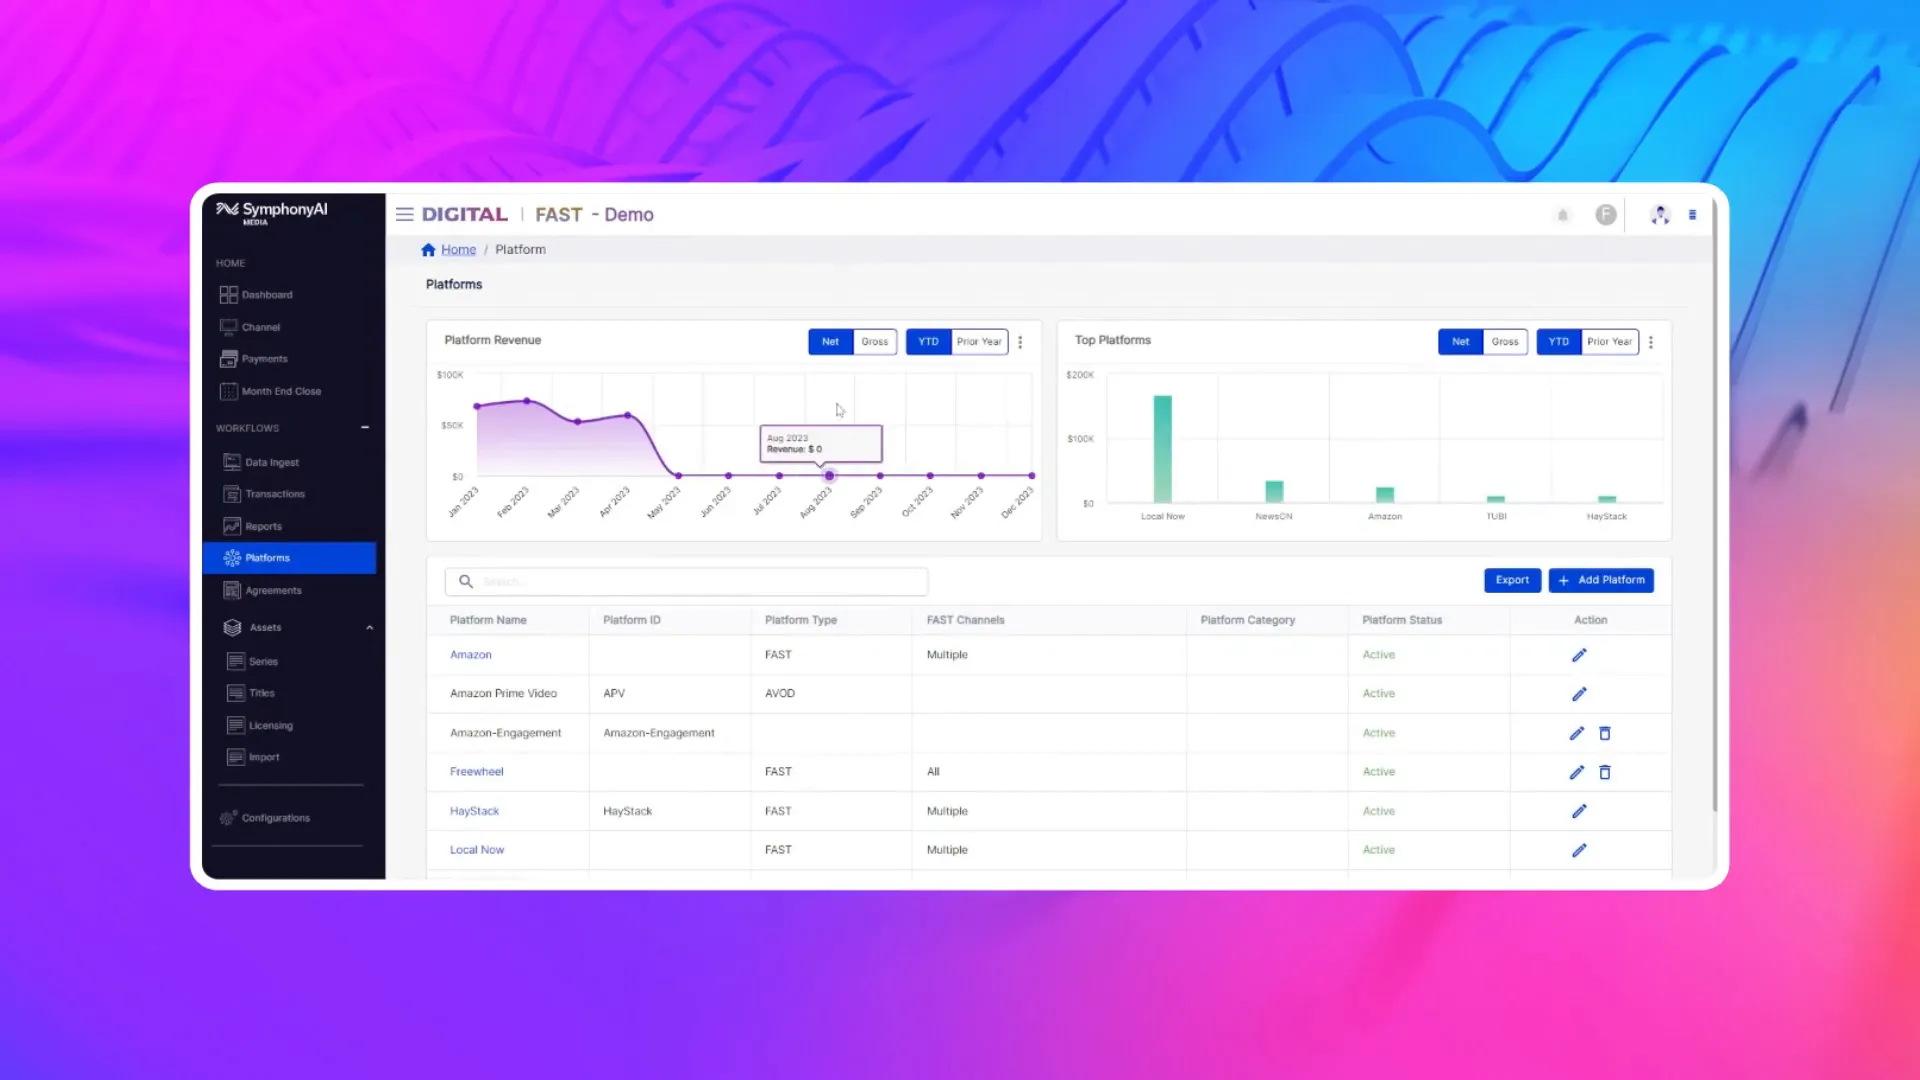
Revedia Tutorial: Dashboard and Analytics

Dashboard from SymphonyAI Media showing platform revenue and top platforms charts with data from January to December 2023, a menu on the left with options like Dashboard, Channel, Payments, and Platforms, and a table listing platforms such as Amazon, Amazon Prime Video, Freewheel, HayStack, and Local Now, including details like platform ID, type, FAST channels, category, status, and action icons for editing and deleting.

Media

6.24.2023

Video

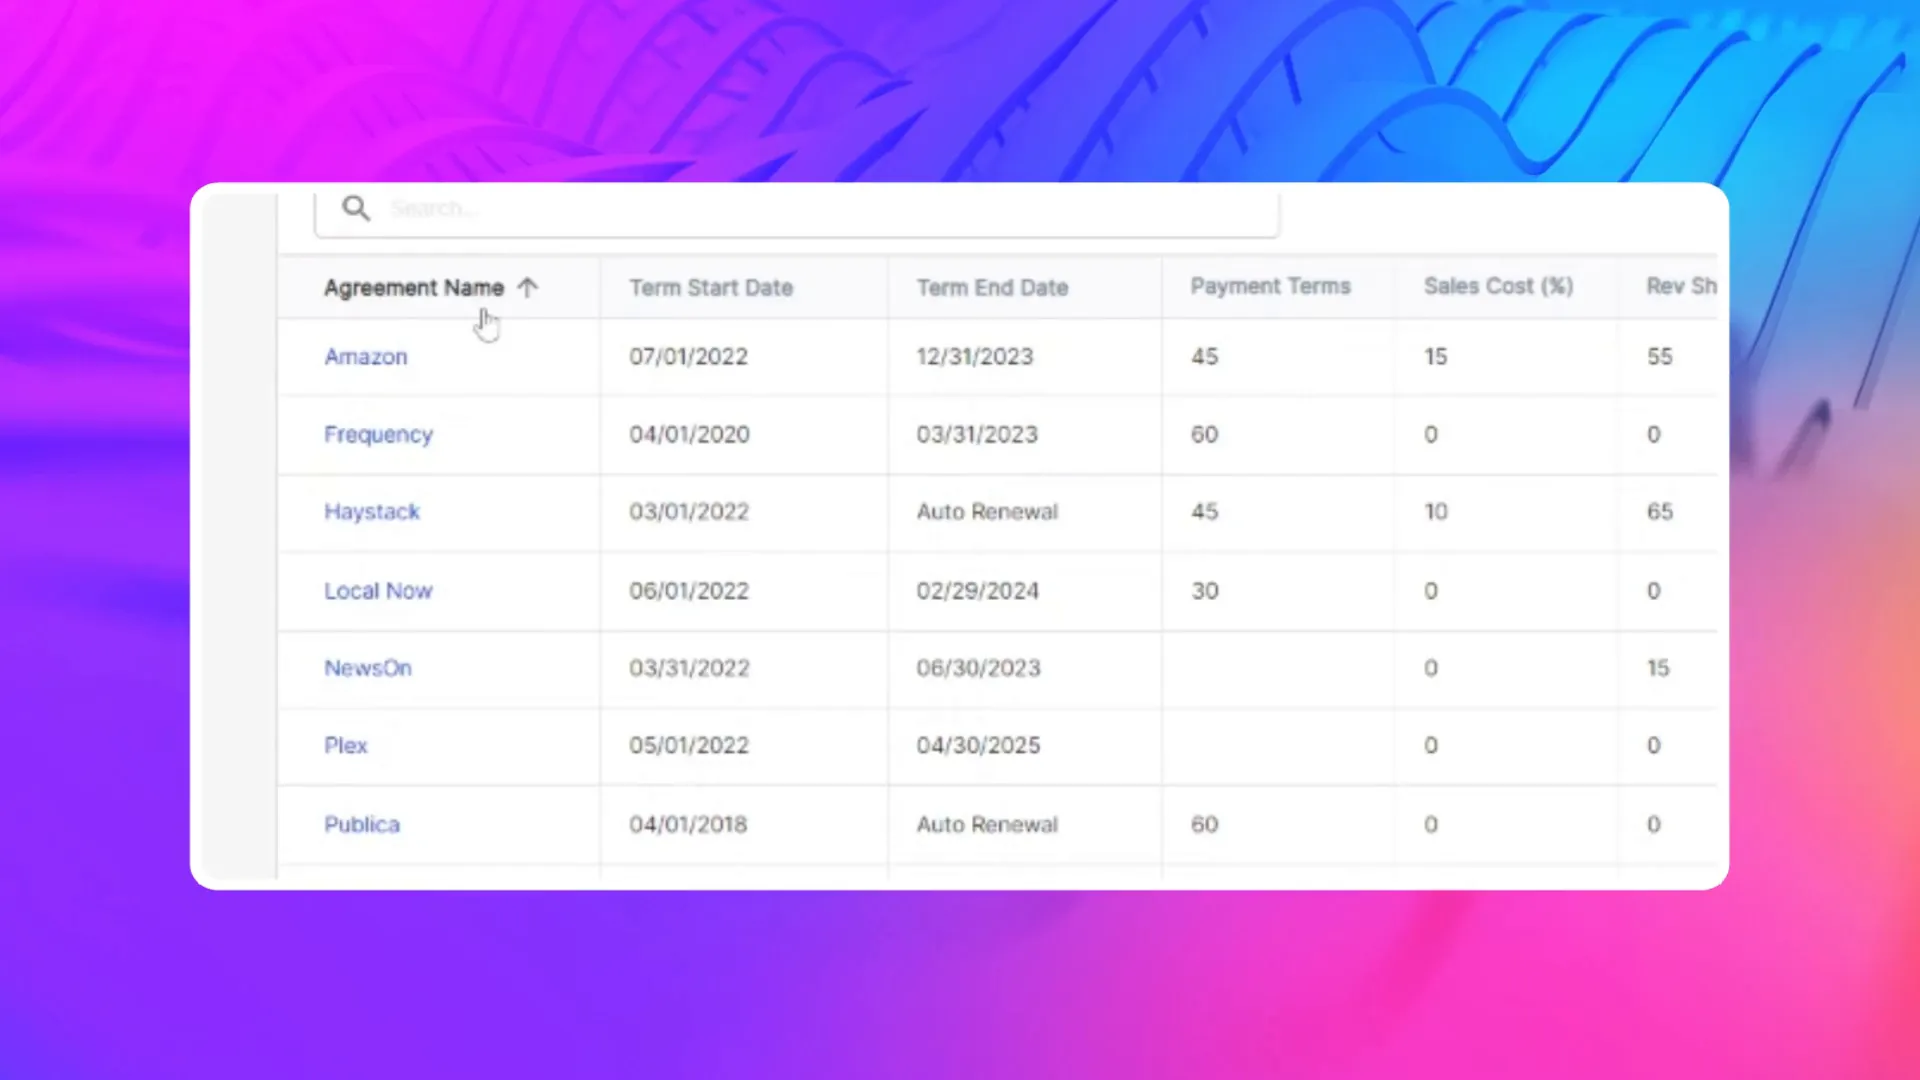
Revedia Tutorial: Agreement Management

Table displaying agreement details including columns for Agreement Name, Term Start Date, Term End Date, Payment Terms, Sales Cost (%), and Revenue Share with entries for Amazon, Frequency, Haystack, Local Now, NewsOn, Plex, and Publica, showing dates, payment terms, percentages, and auto renewal status.

Media

6.23.2023

Video

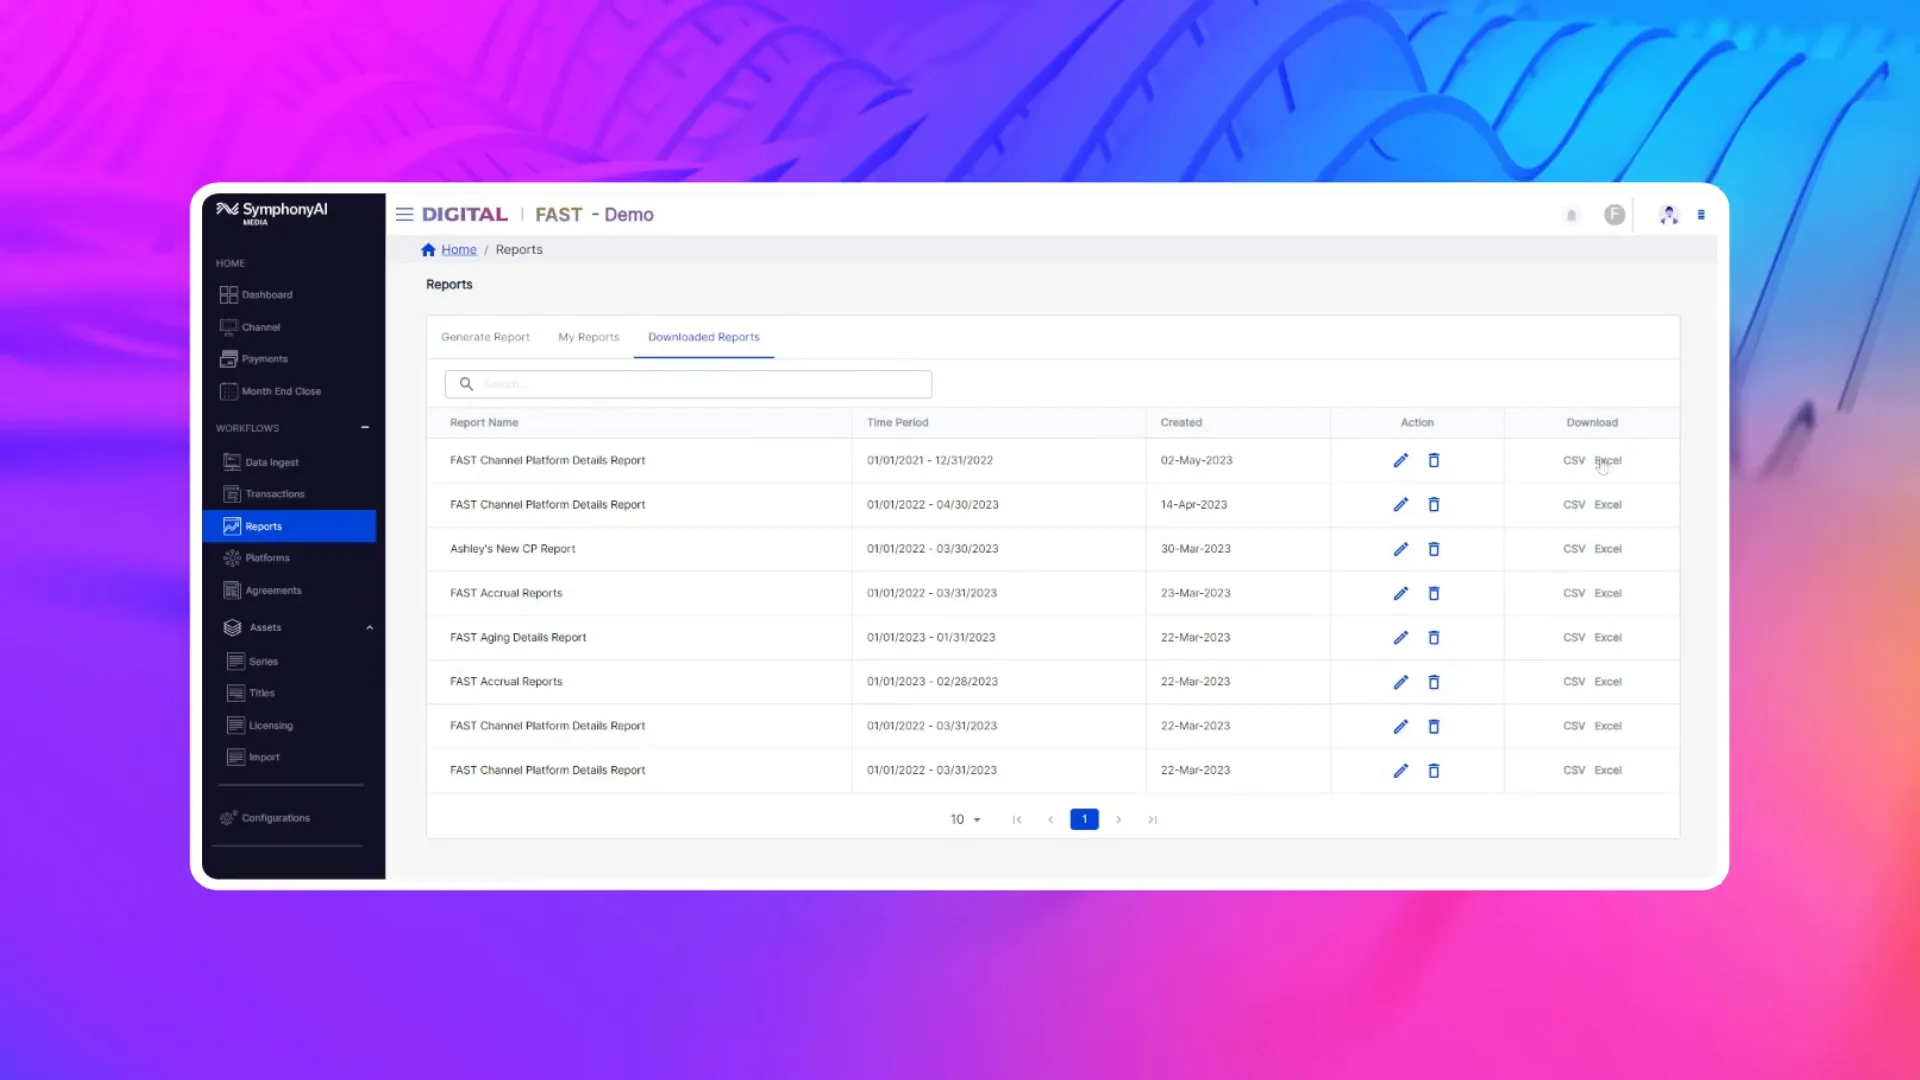
Revedia Tutorial: Reporting

Screenshot of a digital reporting platform interface titled DIGITAL | FAST - Demo by SymphonyAI Media, showing the Reports section with tabs for Generate Report, My Reports, and Downloaded Reports. The Downloaded Reports tab is active, displaying a table listing report names, time periods, creation dates, and options to edit, delete, or download each report as CSV or Excel files. The left navigation menu includes Dashboard, Channel, Payments, Month End Close, Data Ingest, Transactions, Reports, Platforms, Agreements, Assets, Series, Titles, Licensing, Import, and Configurations.

Media

6.21.2023

Blog

Building a Strong Media Revenue Operations Team in 2023: Essential Skills and Tools

Digital futuristic visualization of blue data streams converging toward a bright glowing orange light at the center on a dark background.

Media

6.20.2023

Blog

The Artificial Intelligence Act in Europe: what does it mean for AML compliance?

European Union flags with blue background and circle of twelve yellow stars flying on flagpoles in front of a modern glass building.

Financial Services

6.16.2023

Webinar

Magical Merchandising

Young woman with curly hair wearing an orange shirt holding an apple and reaching for produce on a shelf in a grocery store.

Retail / CPG