Agentic AI

Smart Utilities Agent

Designed to analyze data, learn, and automate complex decision-making processes within the energy sector. These agents manage energy consumption and production by forecasting demand and renewable energy generation, optimizing grid operations, and automating energy trading, all to increase efficiency, reliability

Grid Controls
Energy Balance
Outage Response
Smart Metering

Optimize grid operations

Monitor and control distributed energy resources in real-time. Balance supply and demand while maintaining grid stability and efficiency.

Network monitoring
Track power flow and equipment status across the grid.

Demand response
Adjust distribution based on real-time consumption patterns.

Asset optimization
Maximize equipment lifecycle and prevent failures.
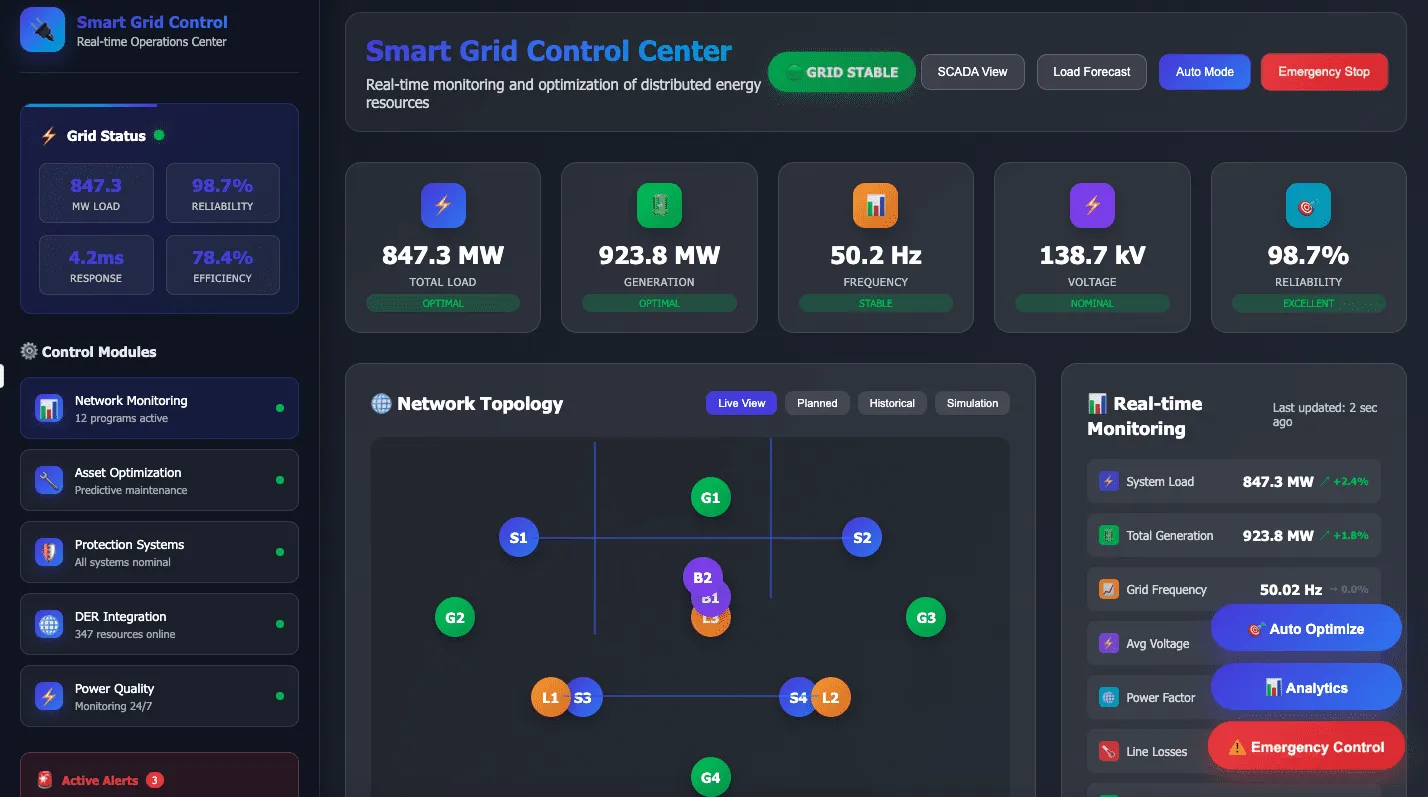
Smart Grid Control Center dashboard showing real-time monitoring and optimization data for a distributed energy system, including total load at 847.3 MW, generation at 923.8 MW, frequency at 50.2 Hz, voltage at 138.7 kV, and reliability at 98.7%. The interface has sections for grid status, control modules like network monitoring and asset optimization, a network topology map with labeled nodes, and real-time monitoring updates with options for auto optimization, analytics, and emergency control.

Manage power flows

Coordinate energy distribution across complex networks. Optimize power generation and consumption using predictive analytics.

Load balancing
Distribute power efficiently based on demand forecasts.

Loss reduction
Identify and minimize transmission losses.

Supply optimization
Coordinate multiple generation sources efficiently.
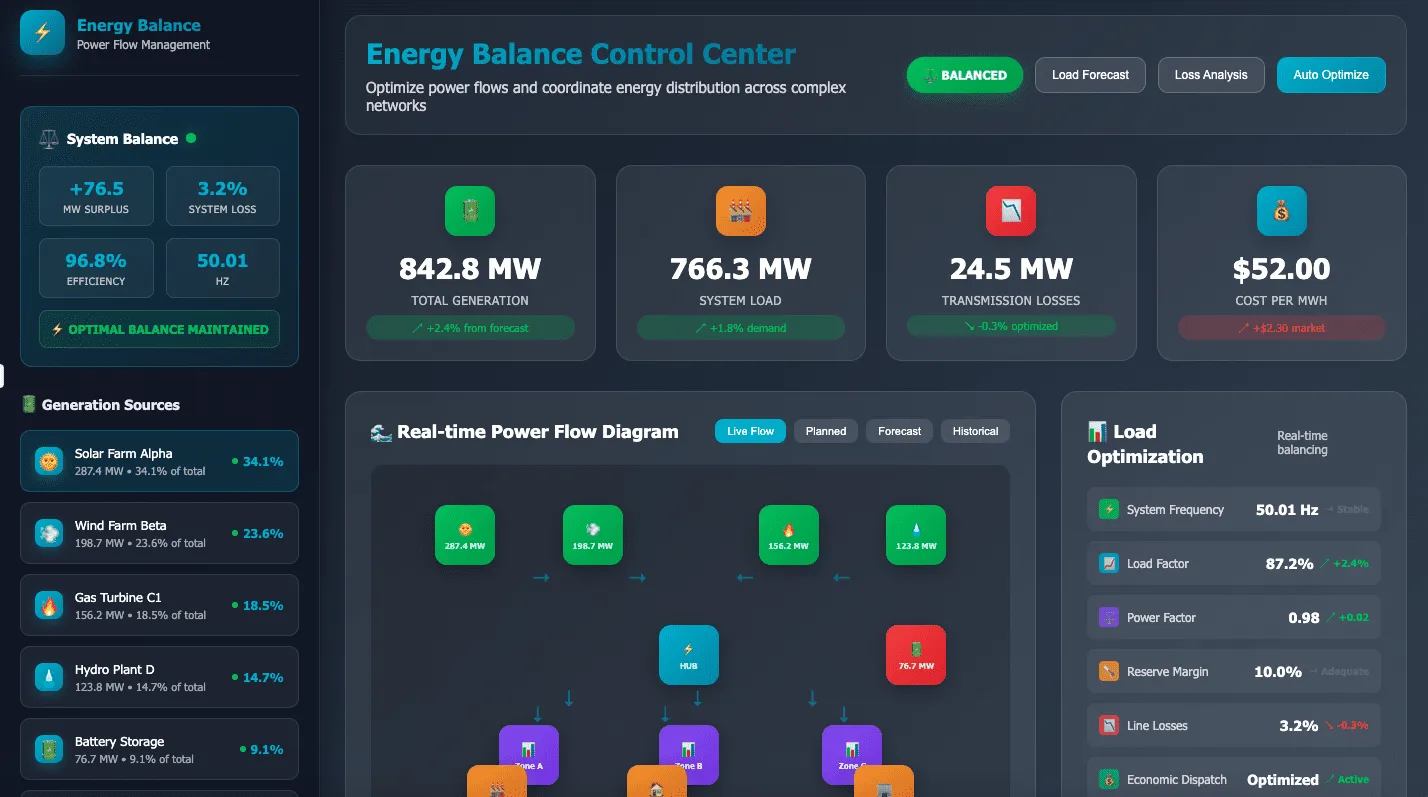
Dashboard titled Energy Balance Control Center showing power flow management metrics including system balance with +76.5 MW surplus, 3.2% system loss, 96.8% efficiency, and 50.01 Hz frequency. Generation sources listed by contribution: Solar Farm Alpha 34.1%, Wind Farm Beta 23.6%, Gas Turbine C1 18.5%, Hydro Plant D 14.7%, Battery Storage 9.1%. Key values shown: total generation 842.8 MW, system load 766.3 MW, transmission losses 24.5 MW, and cost per MWh $52.00. Real-time power flow diagram depicts energy movement among sources, hub, and zones. Load optimization panel displays system frequency, load factor, power factor, reserve margin, line losses, and economic dispatch status.

Minimize disruptions

Detect and respond to network issues before they affect service. Speed up restoration through automated diagnosis and work orders.

Fast detection
Identify potential failures before they occur.

Impact assessment
Evaluate affected areas and prioritize responses.

Service restoration
Coordinate repair teams and track resolution progress.
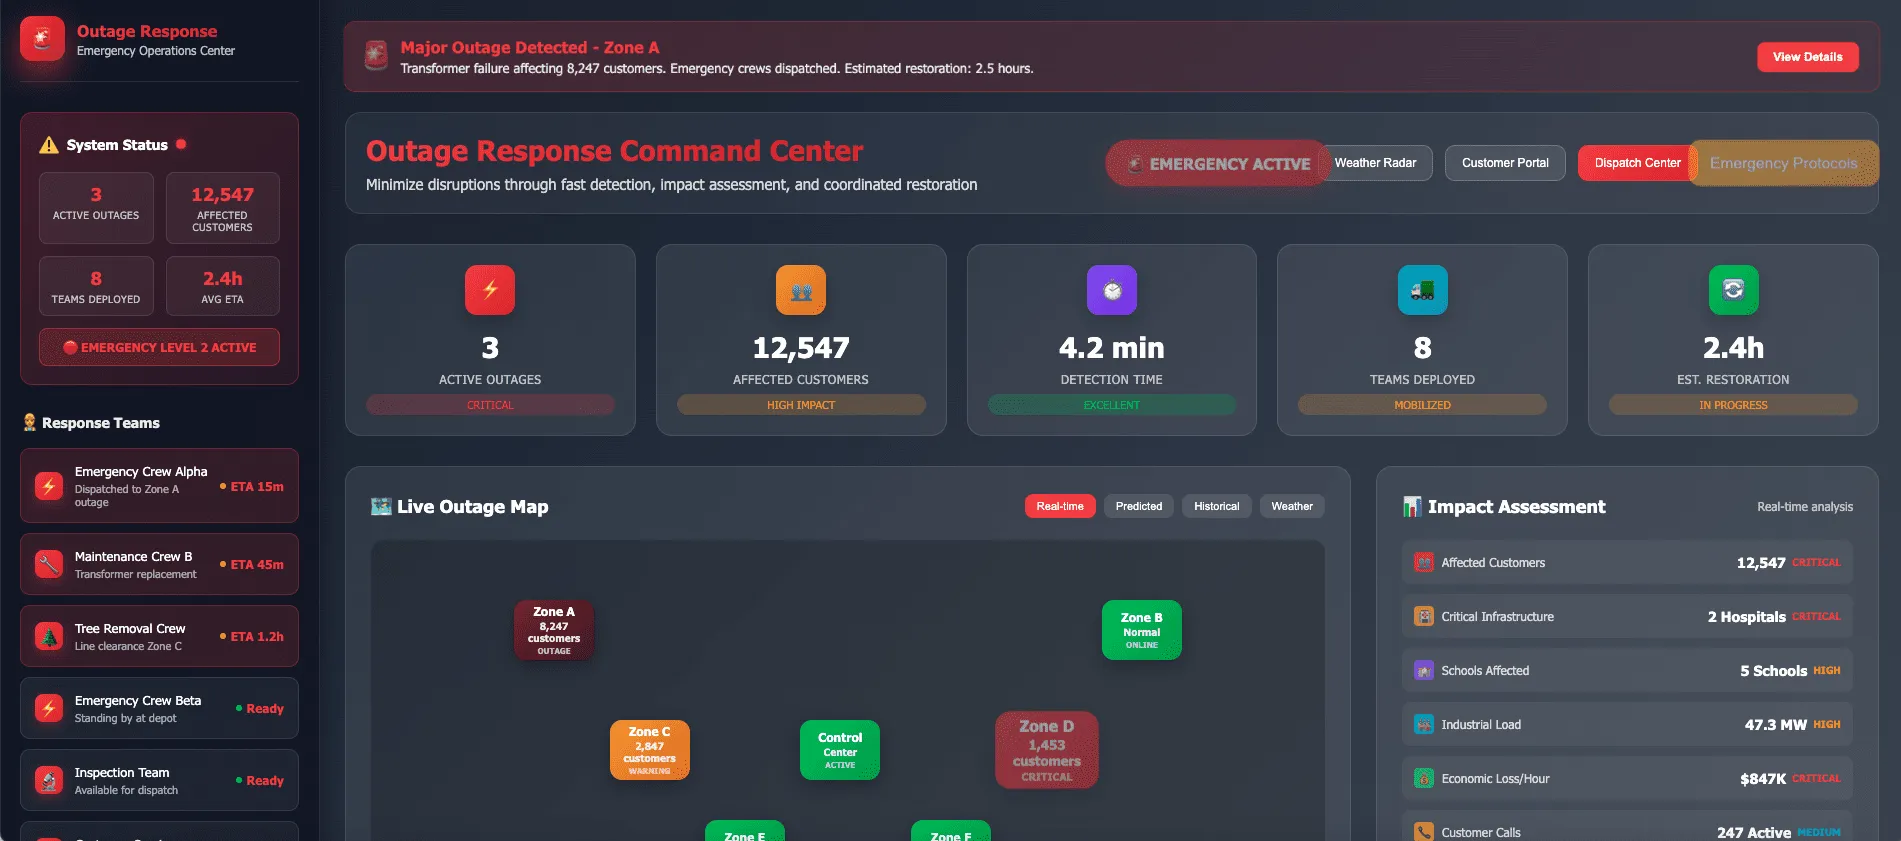
Dashboard of an outage response command center showing system status with 3 active outages affecting 12,547 customers, 8 teams deployed, average ETA of 2.4 hours, and emergency level 2 active; major outage detected in Zone A impacting 8,247 customers with estimated restoration of 2.5 hours. Response teams listed include Emergency Crew Alpha, Maintenance Crew B, Tree Removal Crew, Emergency Crew Beta, and Inspection Team. A live outage map displays zones with status indicators. Impact assessment section details affected customers, critical infrastructure, schools affected, industrial load, economic loss per hour, and customer calls.

Track consumption

Monitor and analyze usage patterns across the network. Enable data-driven decisions for both operators and consumers.

Usage analysis
Track consumption patterns and identify anomalies.

Billing accuracy
Ensure precise measurement and reporting.

Customer insights
Provide actionable feedback for energy optimization.

Smart Metering Analytics Center dashboard showing meter network stats with 47,832 active meters at 99.7% online rate, 287.4 MW total load, 2.3 million daily readings, and real-time data streaming. Displays current consumption 287.4 MW (+2.1% vs yesterday), daily readings 2.3M (100% collection rate), monthly revenue $8.47M (+3.2% accurate billing), 23 anomalies detected (-8 from last week), and 0.3% meter failures (-0.1% improvement). Meter categories listed: Residential 34,247 meters (71.6%) at 99.8%, Commercial 8,947 meters (18.7%) at 99.5%, Industrial 3,247 meters (6.8%) at 99.9%, Solar Prosumers 1,247 meters (2.6%) at 98.9%, EV Charging 144 meters (0.3%) at 97.2%. Includes usage pattern analytics with real-time, hourly, daily, monthly options and customer insights with AI tips on energy saving, usage pattern, and solar optimization.

SymphonyAI’s IRIS Foundry turns that vision into reality. Across core industrial processes—from precision machining to cleaning validation and refinery optimization—IRIS Foundry delivers actionable insights, rapid deployment, and tangible business results. In this ebook, we explore how intelligent applications built on IRIS Foundry are transforming plant operations.