IT Asset Management

Maximize your ROI on enterprise IT assets

Gain complete control and visibility of your hardware assets and software licenses and enforce compliance.
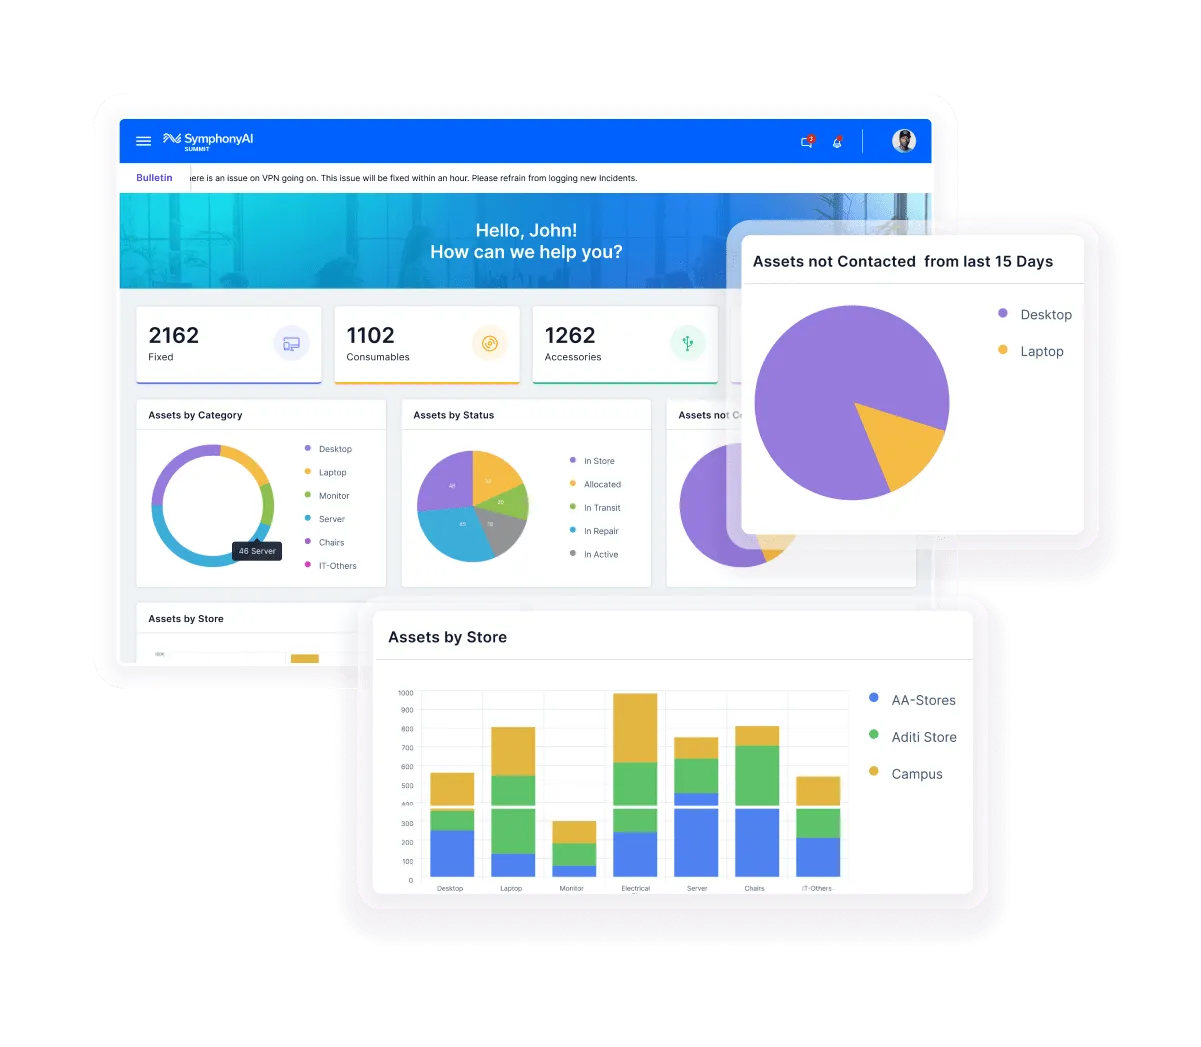
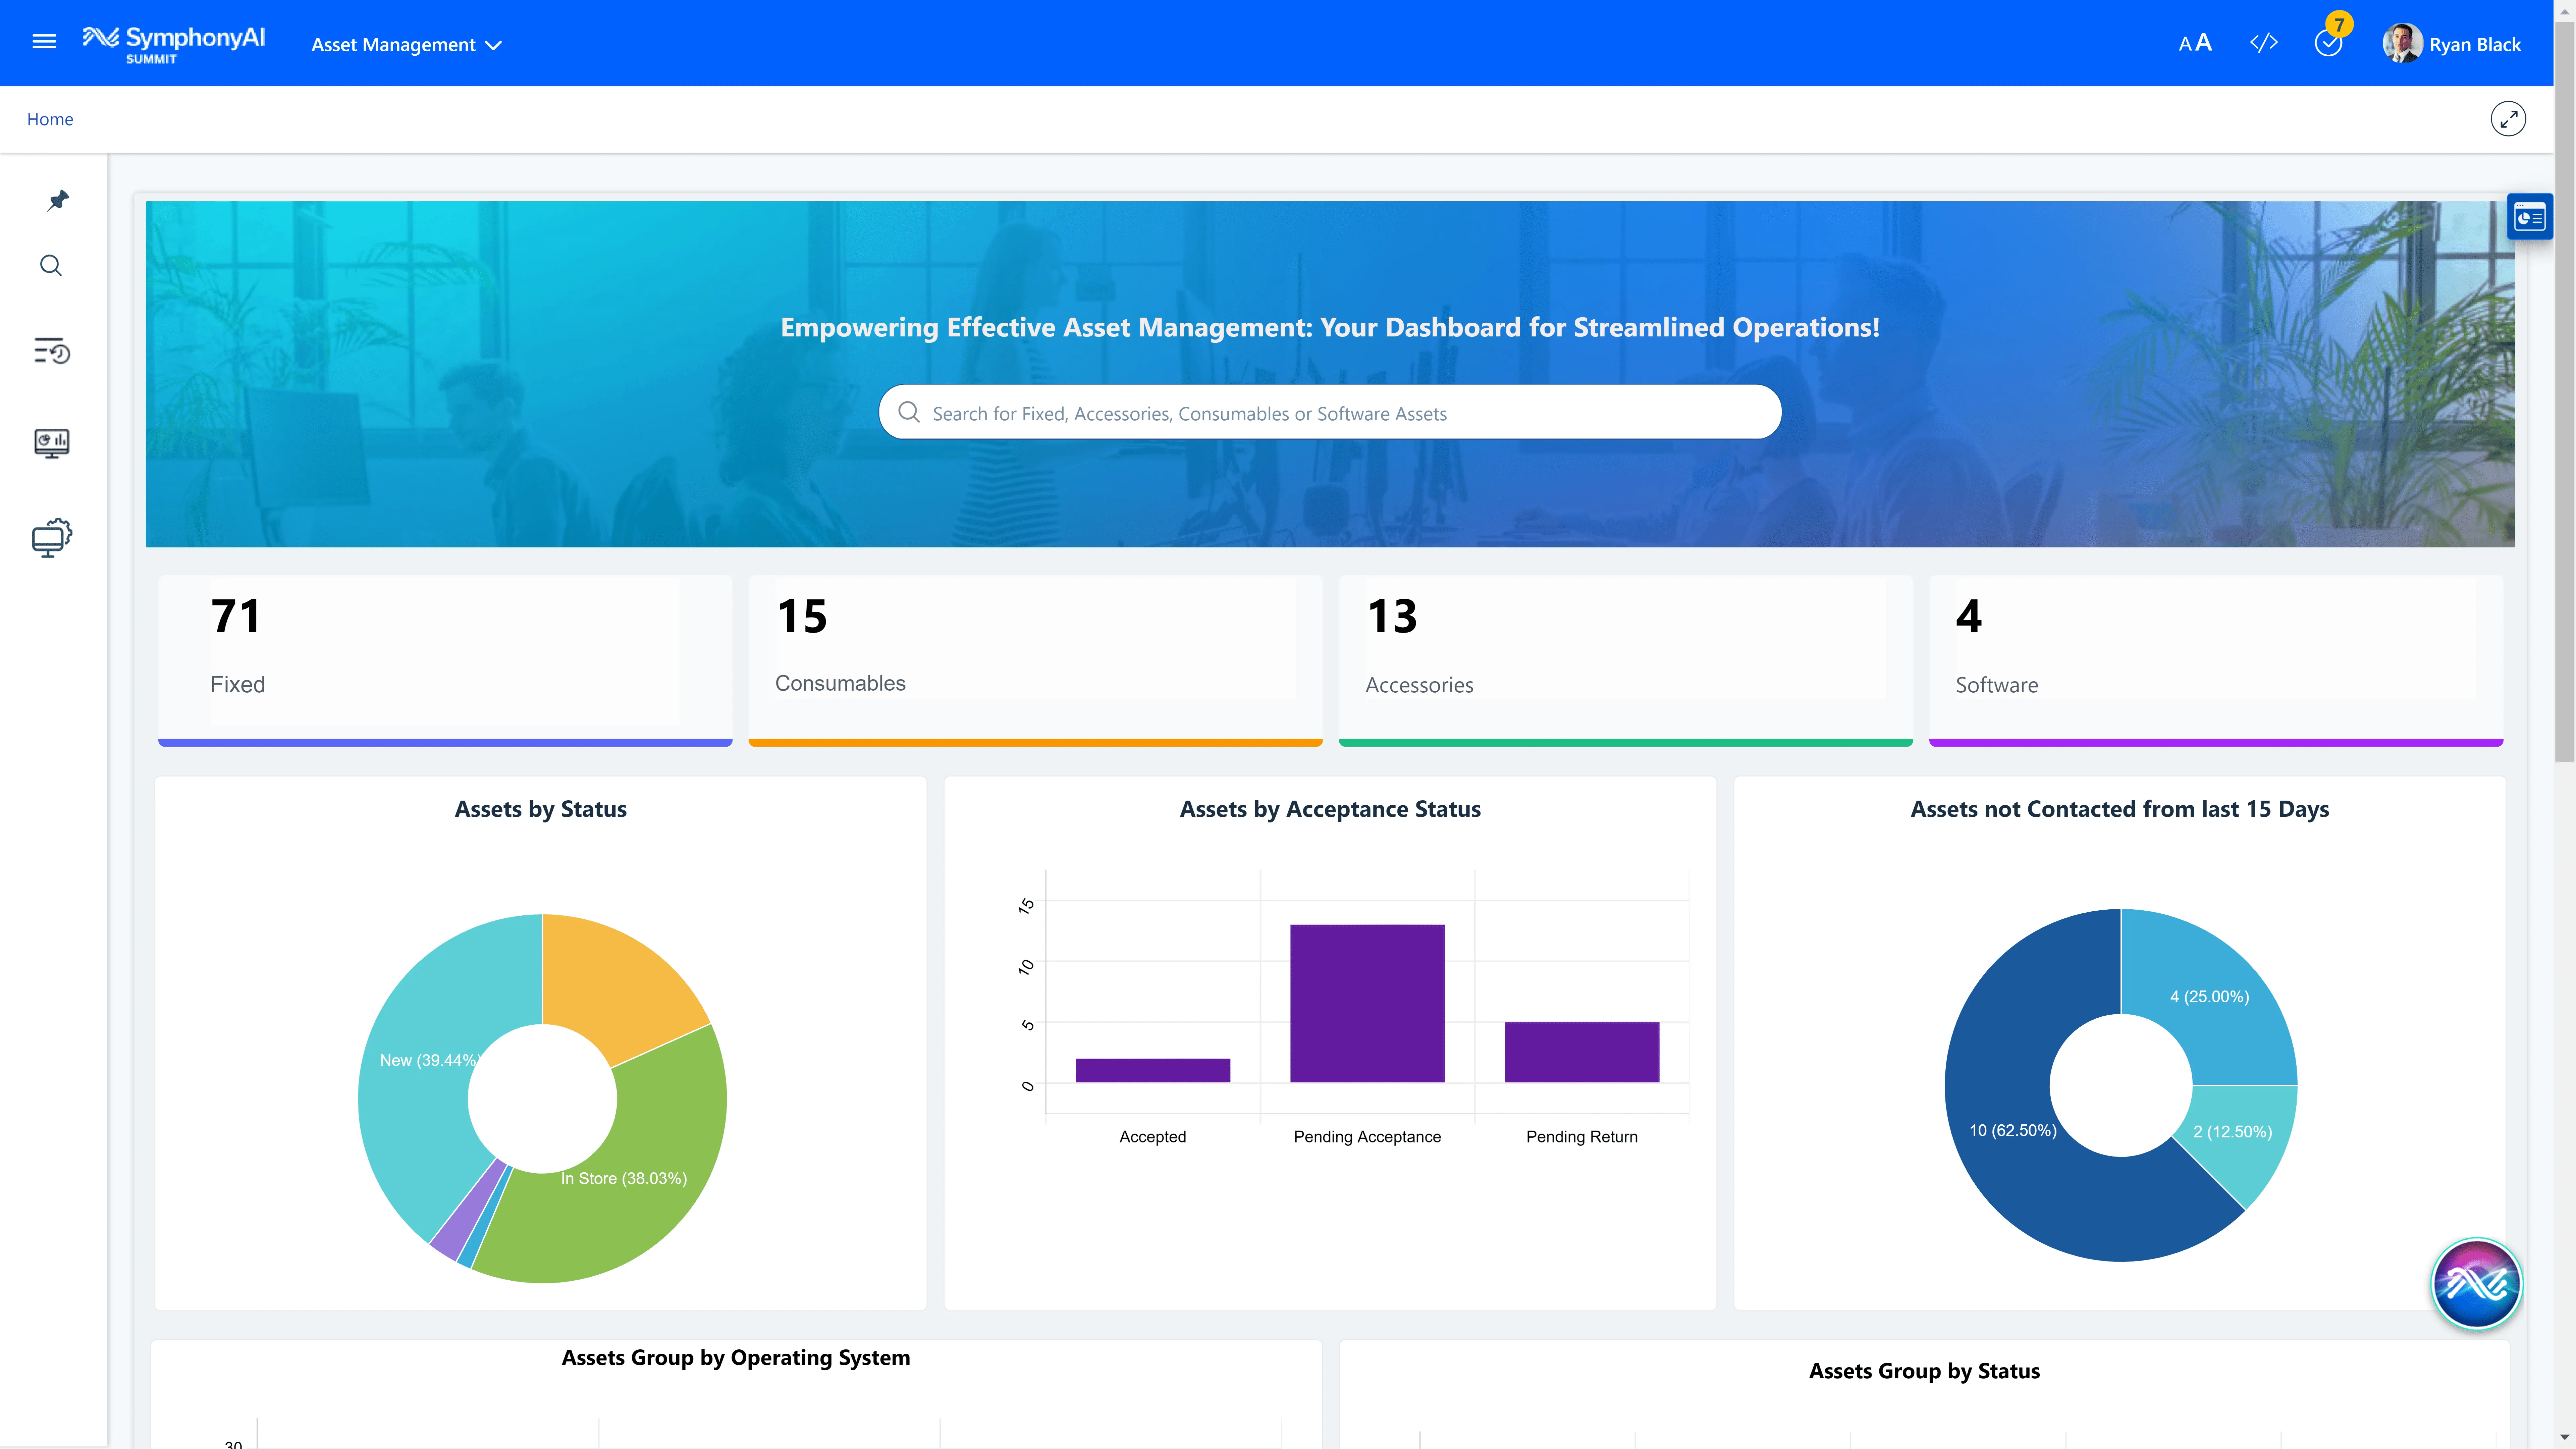
Make informed decisions and improved planning around your IT and non-IT assets. Use SymphonyAI IT Asset Management’s unified interface to get comprehensive asset information from a single pane of glass. Track asset status by region, location, ownership history, asset status, and more.
Ensure you only pay for the software and hardware you’re using. Maximize the value of your assets by tracking usage, redeploying underutilized resources, and eliminating unnecessary expenses.
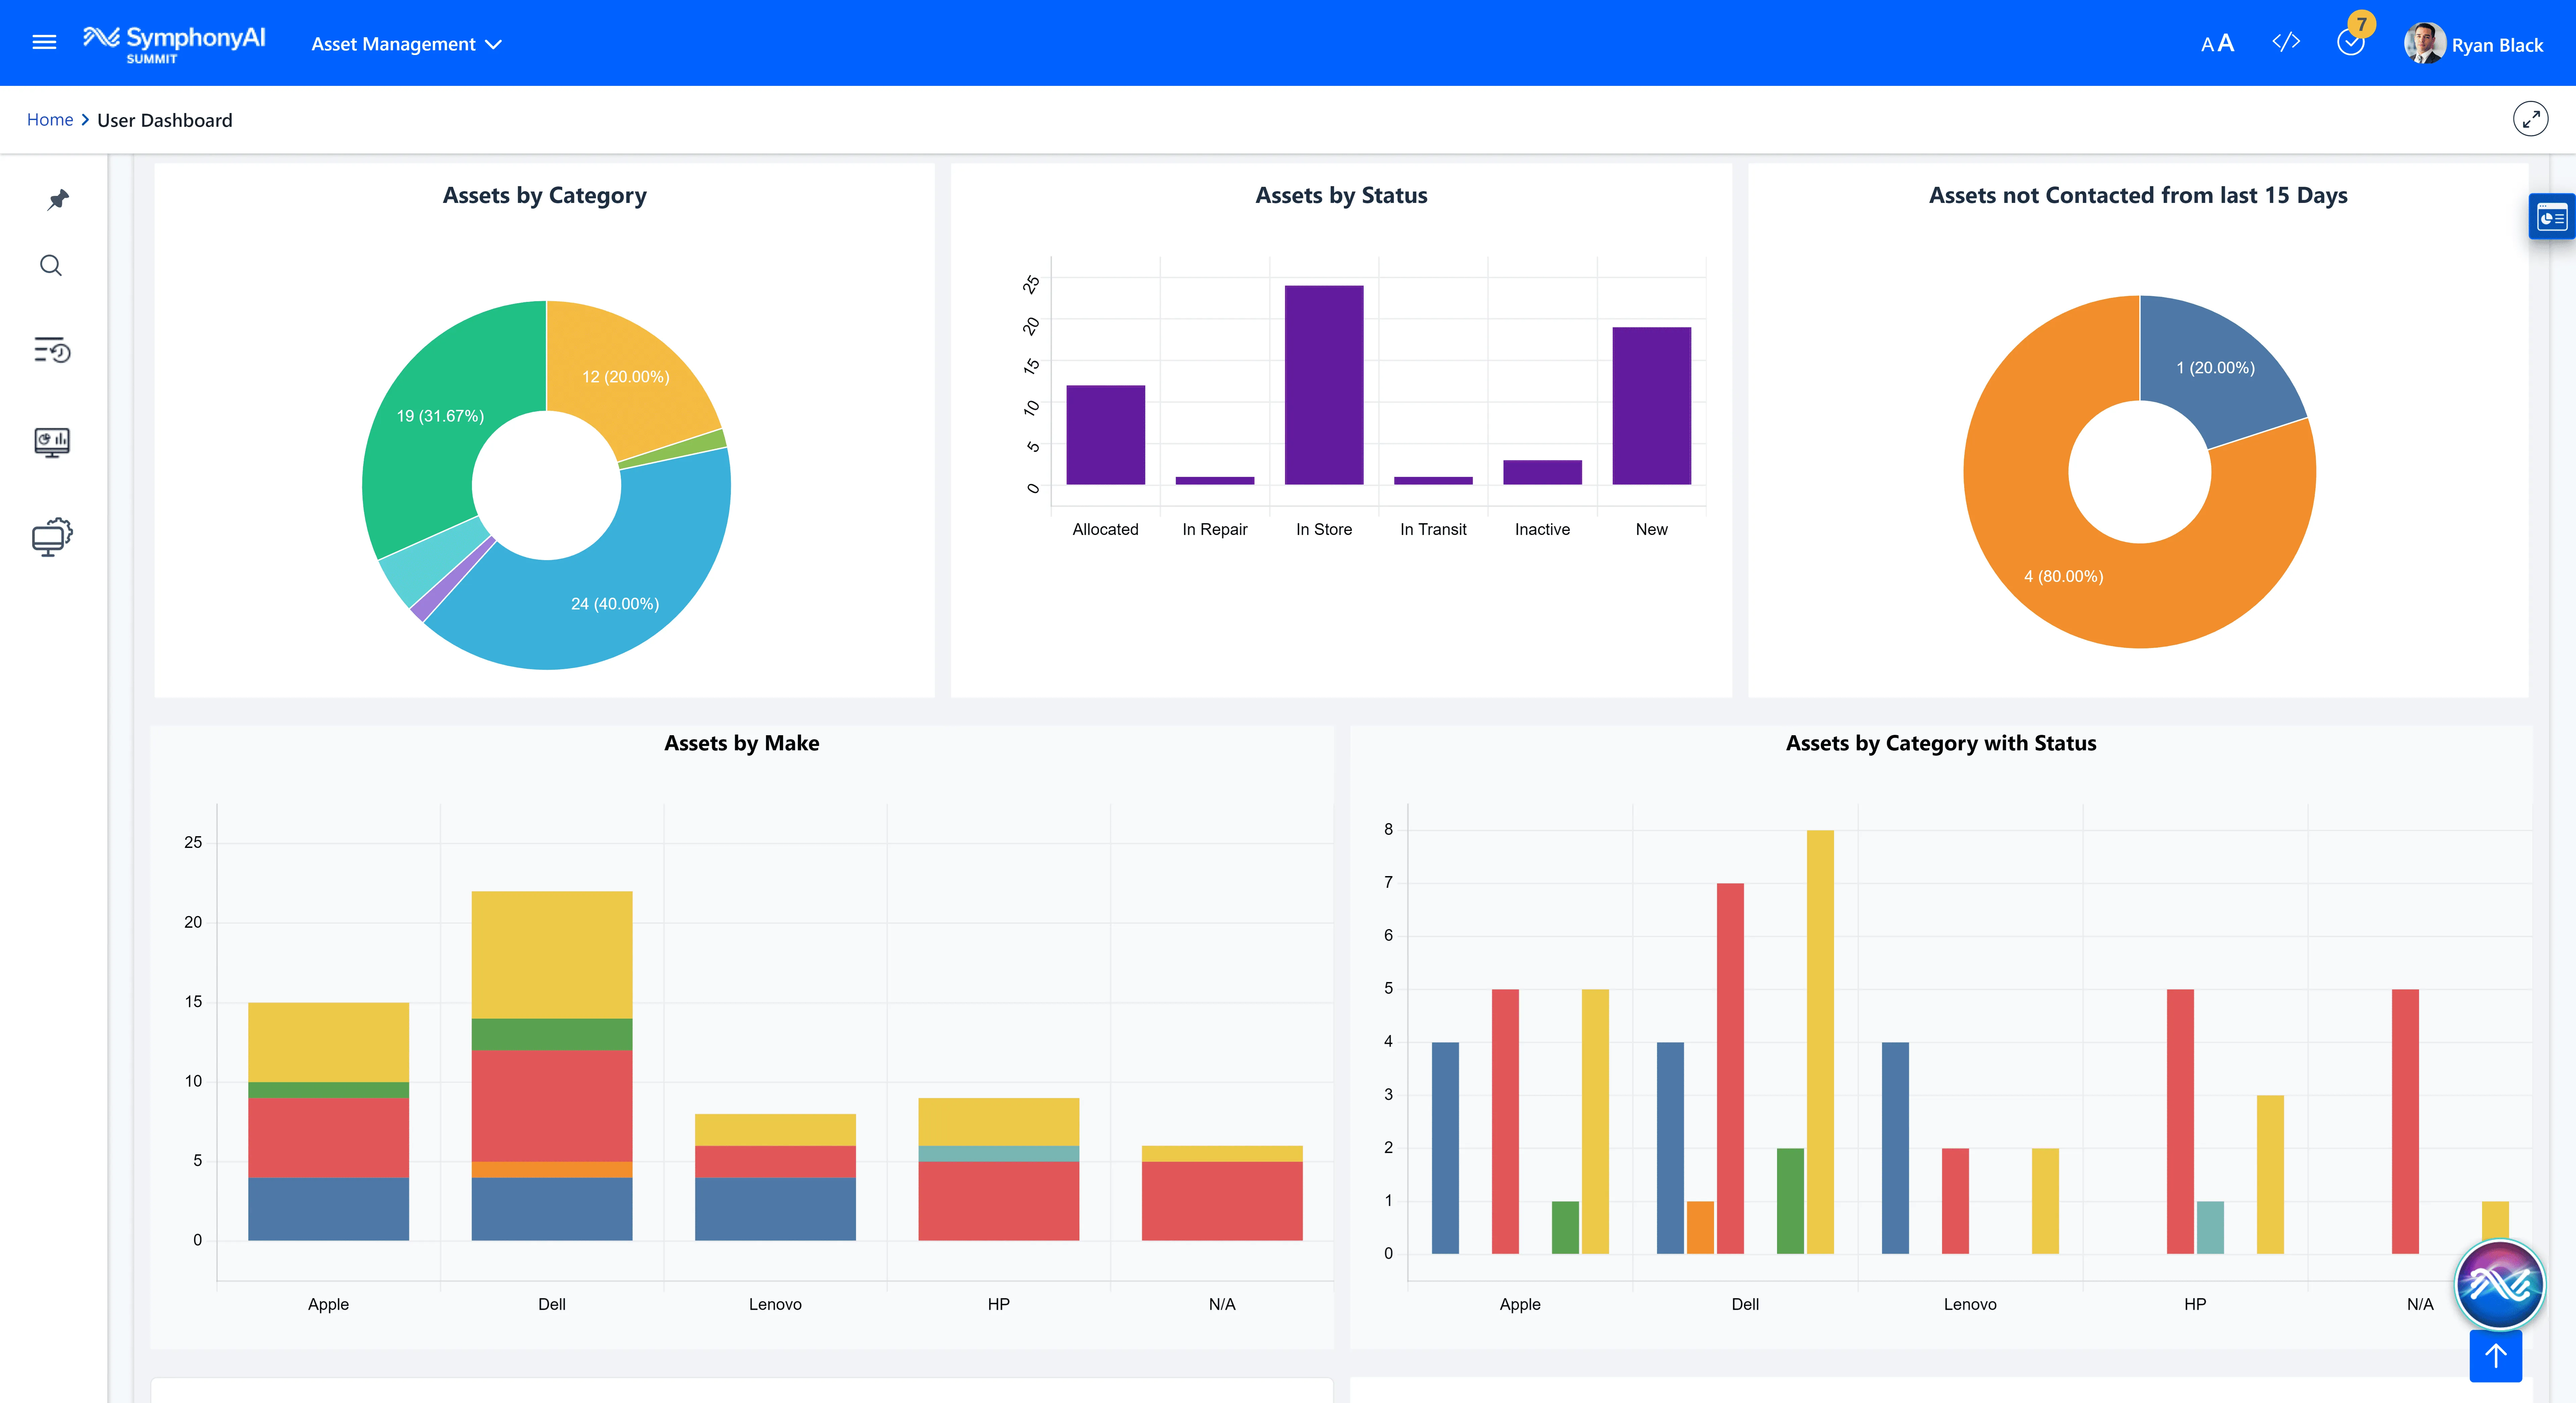
Use SymphonyAI IT Asset Management’s comprehensive analytics to plan technology spending efficiently, right-size contractual agreements, optimize renewals, and identify underused and unmanaged assets. Track business unit spending and minimize waste throughout the asset lifecycle, ultimately reducing your organization’s CapEx and OpEx.
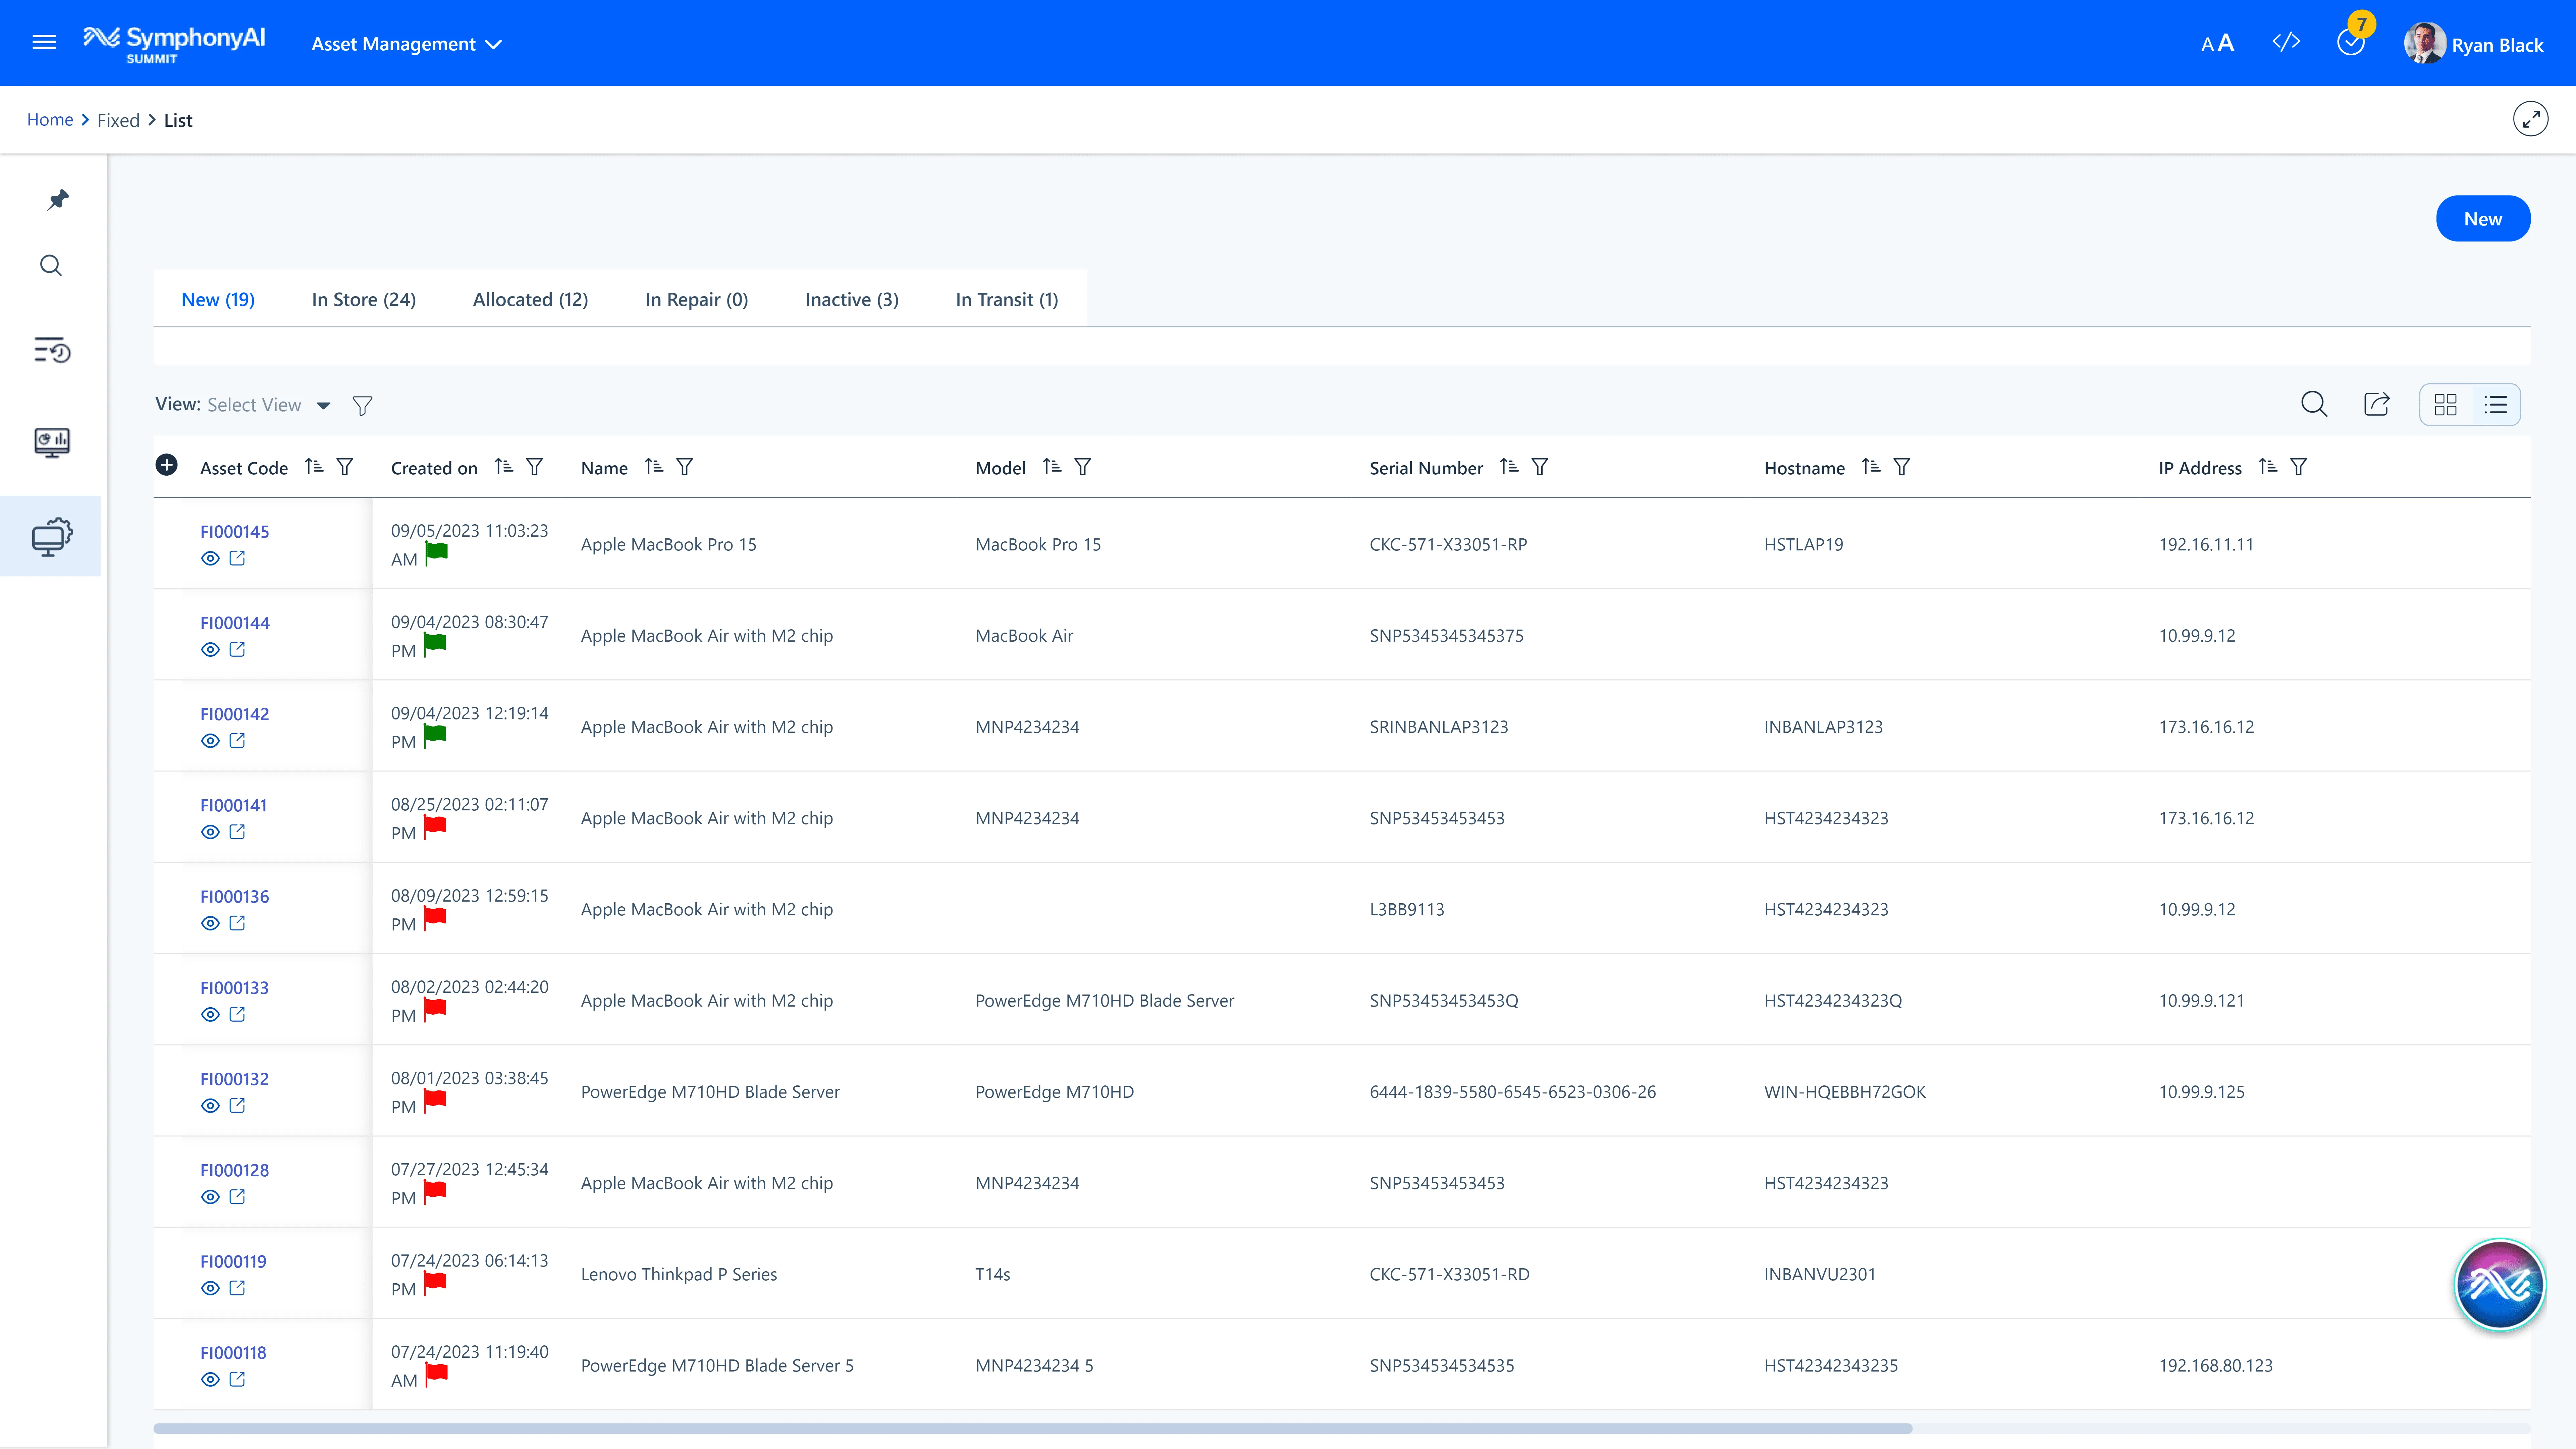
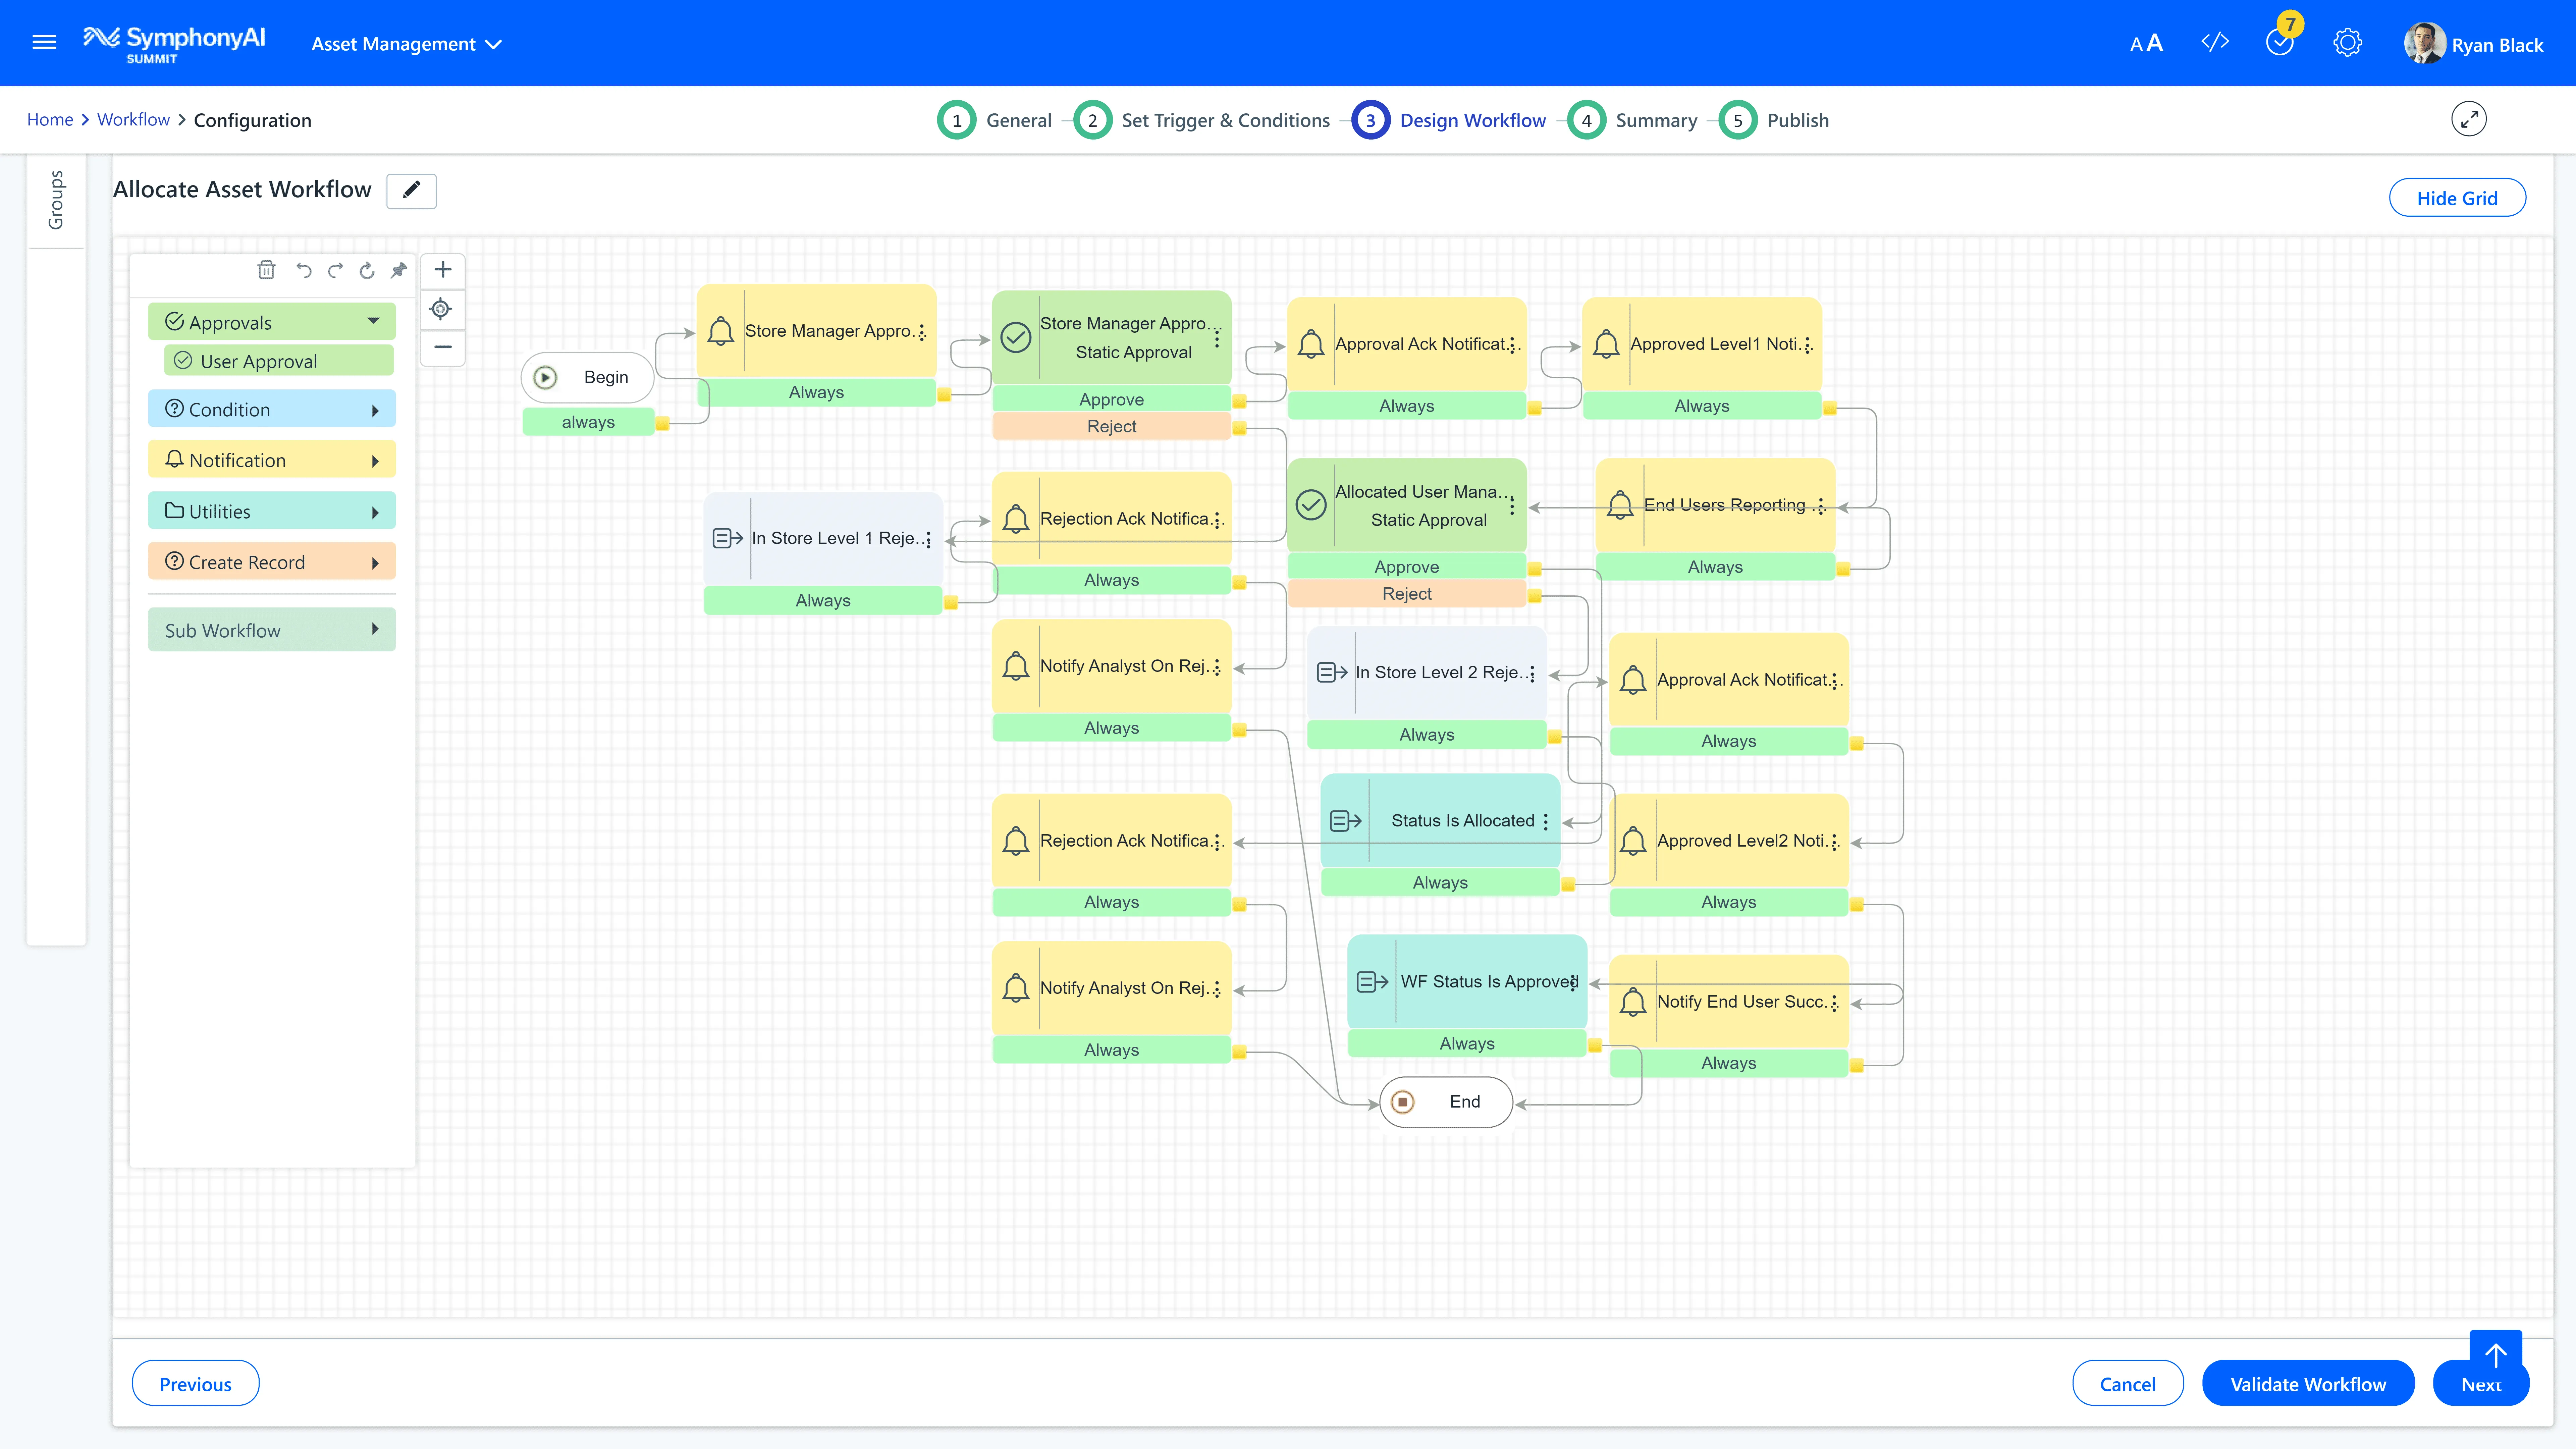
Use SymphonyAI IT Asset Management’s workflow automation to streamline asset lifecycle processes, such as deployment, allocation, maintenance, and retirement. By automating routine tasks and approvals, you can reduce manual errors and improve operational efficiency.
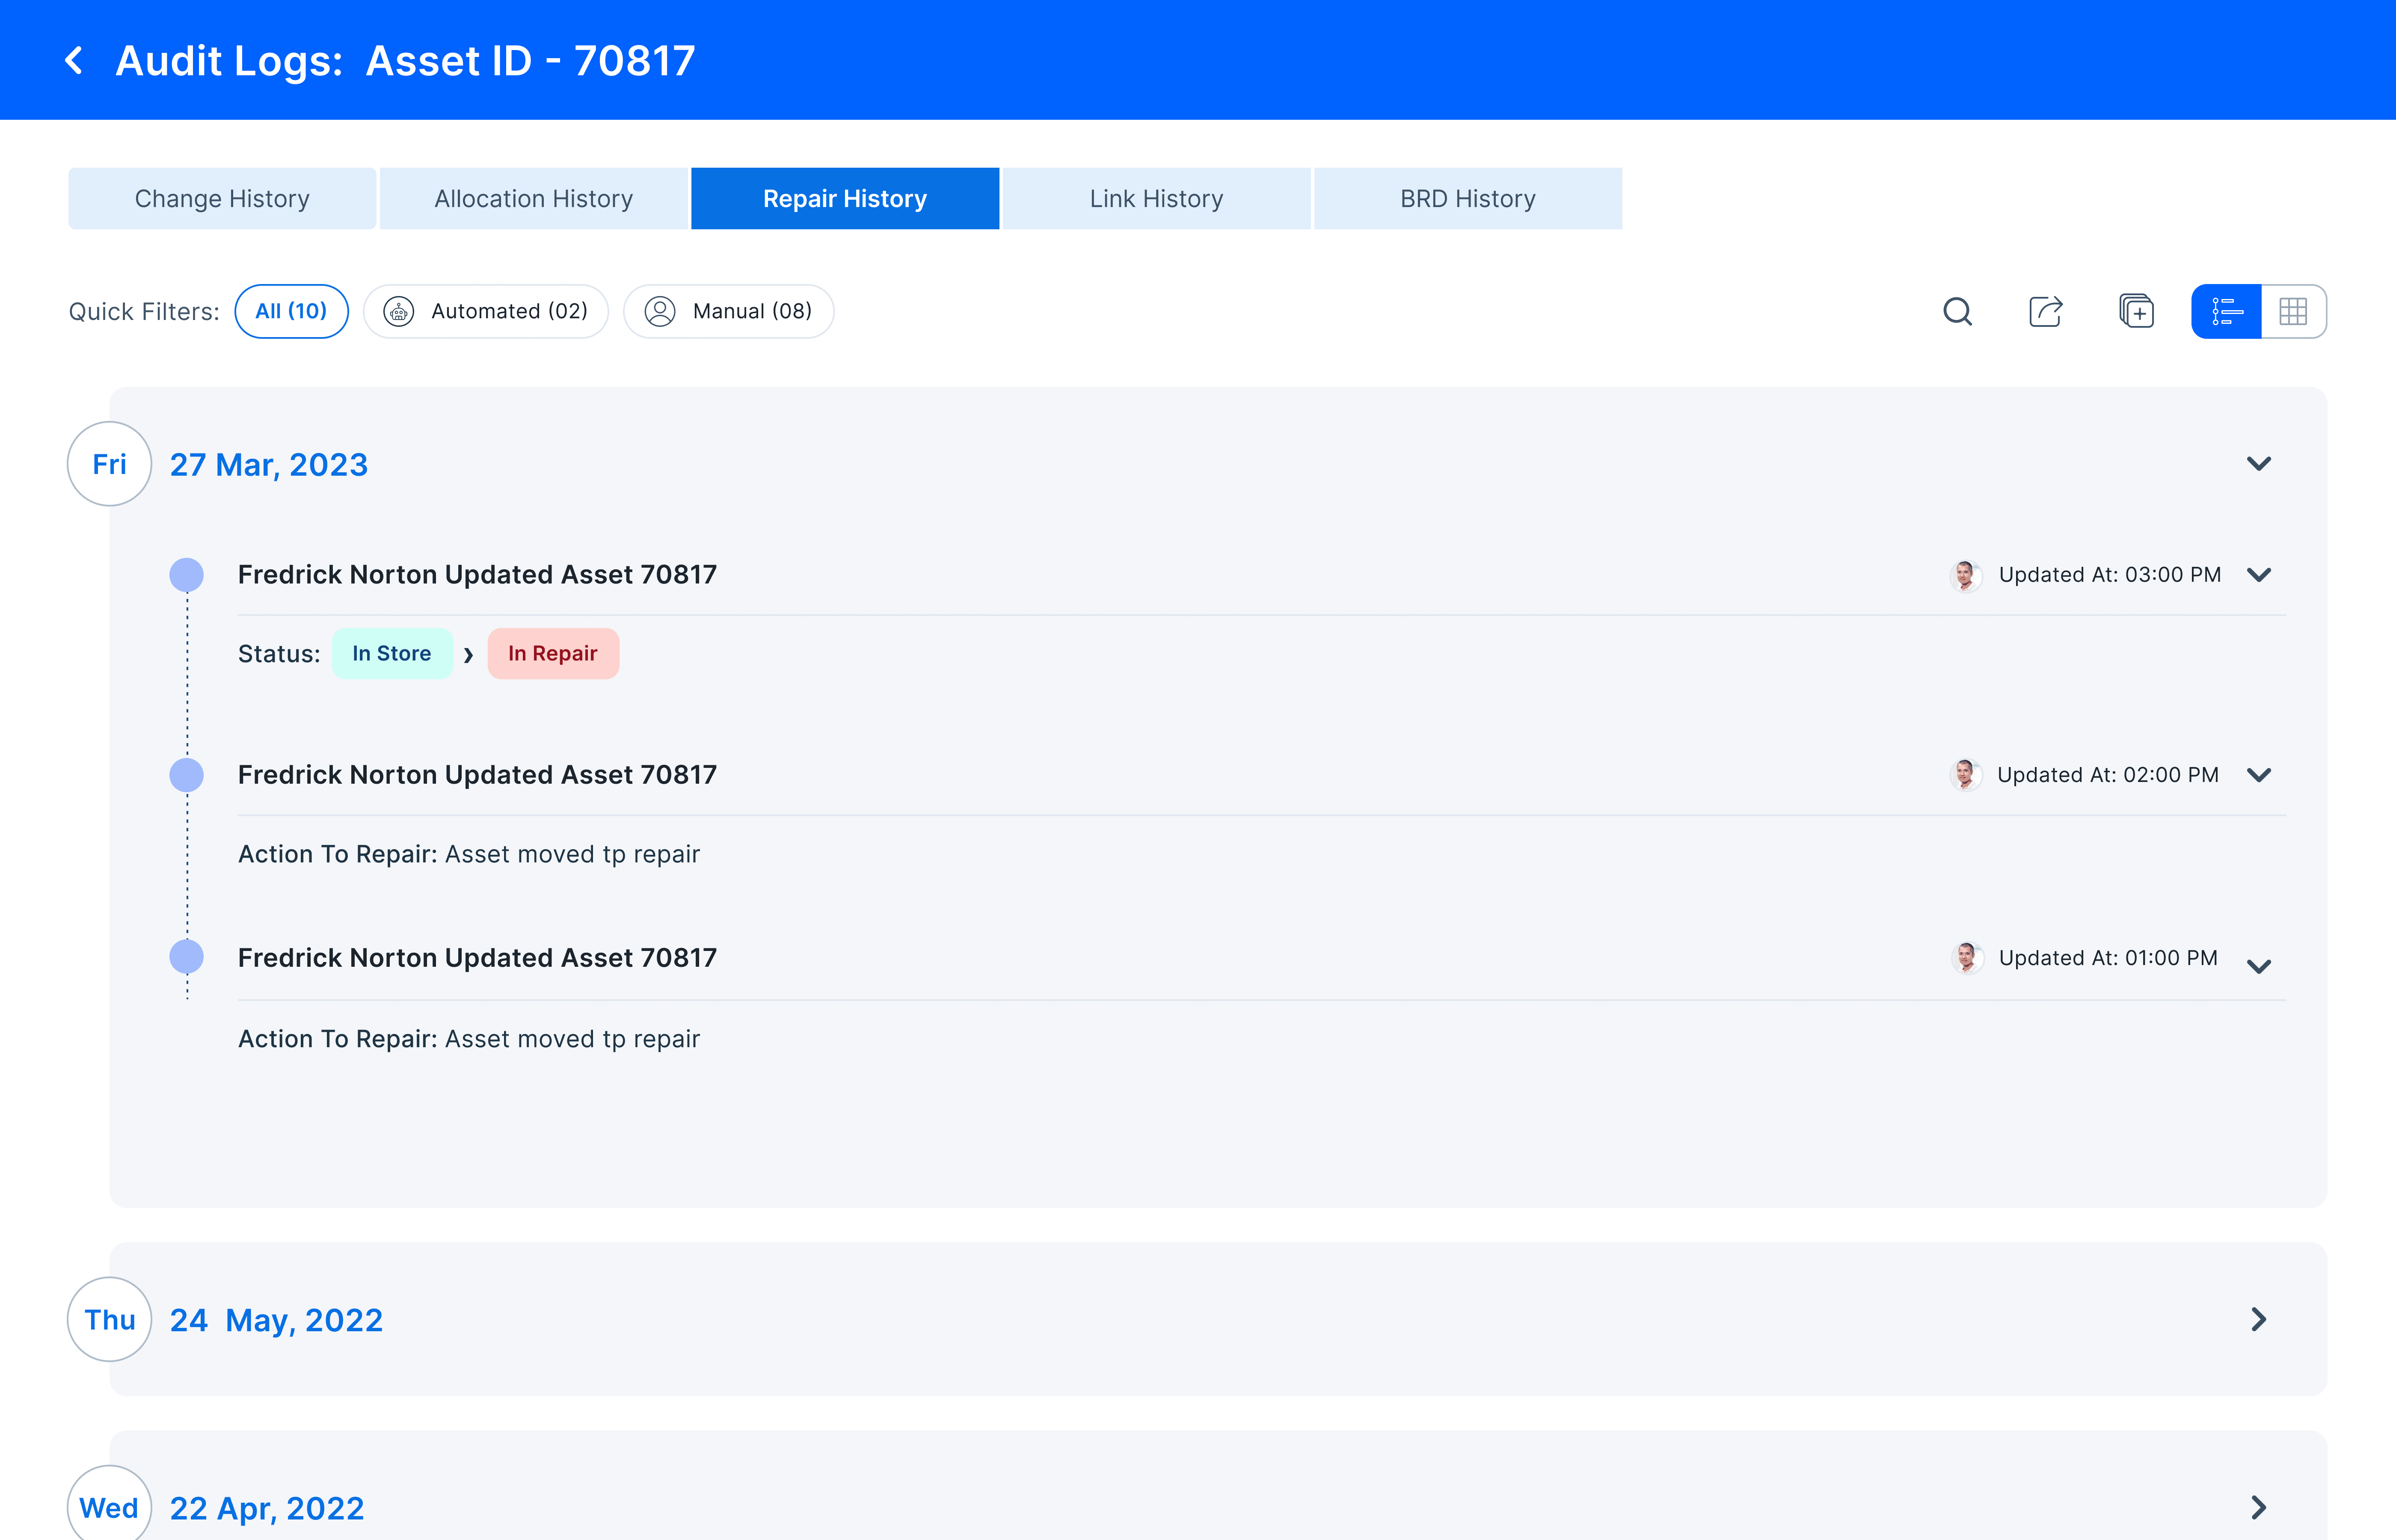
Mitigate technology risks such as license compliance, renewals, and pilferages with ease using SymphonyAI IT Asset Management’s robust compliance features.

In this customer success story, discover how Evalueserve transformed its IT asset management and software compliance processes using SymphonyAI’s intelligent automation platform.

Blue icon depicting a web browser window with three horizontal lines representing a list or text and a magnifying glass overlaying the upper right corner, symbolizing search or audit logging.
IT asset discovery

SymphonyAI Asset Management discovers both agentless and agent-based IT assets.

Icon showing two stacked network servers connected below to three smaller nodes, representing a proxy server setup.
Hardware asset management

Support both IT and non-IT assets, providing complete information on ownership of assets throughout their lifecycle.

Abstract blue graphic of a smartphone with a line graph overlay and binary code elements to the left, symbolizing data mapping and analysis.
Software asset management

Understand and track all software details, from software compliance to license usage.

Abstract blue icon showing six connected circles with arrows forming a circular flow between them, representing a lifecycle or continuous process.
Asset lifecycle management

Manage the end-to-end lifecycle of all asset types including fixed assets, consumables, accessories, and software.

Icon showing a blue user silhouette on the left, a transparent blue rectangle in the center with a white gear symbol, and three horizontal blue lines on the right, representing API-based discovery or user settings integration.
Asset compliance management

Ensure all types of assets comply with regulatory standards and are managed under the necessary standards of the specific business sector.

Blue user silhouette with three check marks on the left and a gear symbol near the head.
Persona dashboards

Track various metrics such as the number of assets, the number of asset-by-asset type and category, discovery status, compliance status, warranty schedule, maintenance schedule, and assets allocated.

Graphic of a web browser window with a large eye icon in the center, a magnifying glass over the eye, and two gears on either side, symbolizing search and settings or customization.
Unified asset management

Automate manual tasks or create new records or send notifications using business rules.

Blue shield with a white heart in the center, a lock on the left, a gear at the bottom, and a checkmark on the top right.
Enhanced security

Streamline asset management with a unified approach by linking assets with records such as change record, problem record, and knowledge article.

Blue gear with two circular arrows inside, connected by a line to two large circles on opposite sides, with binary code digits.
Auto-asset allocation

Reduce manual allocation of assets by using appropriate conditions to allocate an asset.

Blue star-shaped badge icon in the center with lines connecting to six smaller blue squares, three on each side, representing a network or system.
Approver View

Easily keep track of all pending approvals in a centralized platform.

Blue icon of a document with a magnifying glass showing a checkmark in front, with three vertical bars indicating report or data analysis behind the document.
Asset Dashboard

Get to know the complete asset details at just a glance.

Icon showing a blue user silhouette on the left, a transparent blue rectangle in the center with a white gear symbol, and three horizontal blue lines on the right, representing API-based discovery or user settings integration.
Asset Inventory View

Easily perform all asset related actions, flexibly manage inventory, and enhance overall efficiency.

Blue hand icon holding a large checkmark with a gear above, representing task completion and settings or process automation.
Asset Visual Timeline

Effectively monitor and access all asset-related transactions and activities through a unified timeline.

Blue cloud behind a browser window icon showing white arrows pointing up and down, symbolizing data upload and download.
Asset workflows

Automate asset actions and reduce manual tasks by using asset workflows.

Blue icon depicting a web browser window with three horizontal lines representing a list or text and a magnifying glass overlaying the upper right corner, symbolizing search or audit logging.
Business Rule

Automate asset actions and reduce manual efforts.

Blue star-shaped badge icon in the center with lines connecting to six smaller blue squares, three on each side, representing a network or system.
Drag and Drop Controls

Elevate the form to next level with the help of drag and drop controls.

Blue stylized icon of a smartphone with a warning triangle and two clock icons indicating notifications or alerts.
End User Dashboard

Complete comprehensive details in a single intuitive interface.

Blue icon depicting a web browser window with three horizontal lines representing a list or text and a magnifying glass overlaying the upper right corner, symbolizing search or audit logging.
Link Assets With Records

Gain visibility by linking assets with records.

A blue hierarchy diagram with one rectangle at the top connected to a diamond shape below it, which branches out to three rectangles at the bottom.
Organized Asset Form

Get comprehensive details assets by using asset details form.

Blue icon of a document with a magnifying glass showing a checkmark in front, with three vertical bars indicating report or data analysis behind the document.
Robust Filters and Views

Filter the desired assets and save it as view for easy access.

Abstract blue graphic of a smartphone with a line graph overlay and binary code elements to the left, symbolizing data mapping and analysis.
Widgets and Actions

Elevate user interaction and system functionality.

IT Service Management
Digital Agent
Service Automation

Deliver delightful service experience powered by AI. Redefine employee experience and unleash productivity with AI-powered IT and Enterprise Service workflows with a future-ready platform.
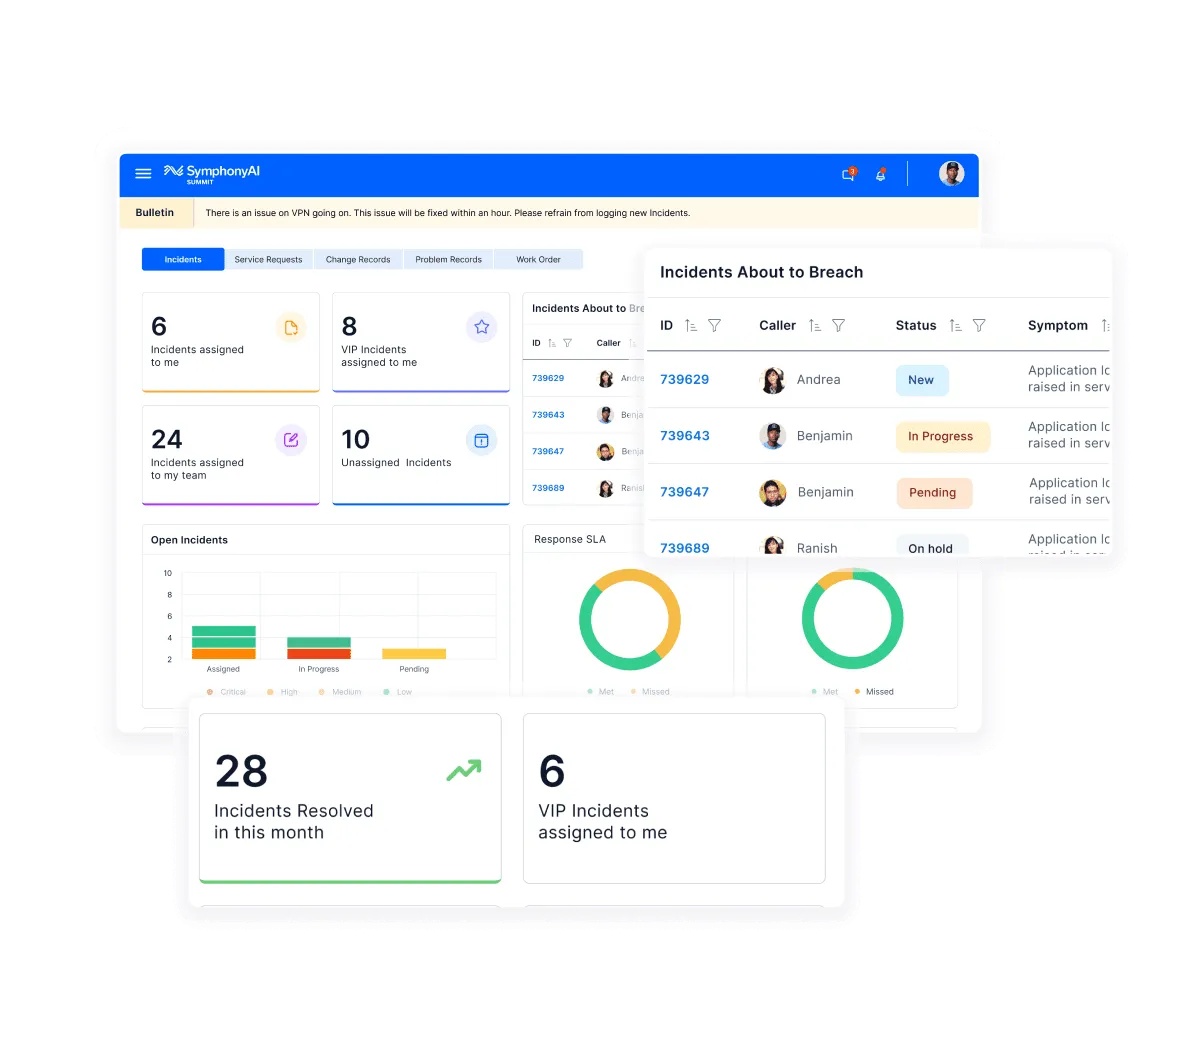
Dashboard of SymphonyAI Summit IT service management showing incident statistics including six incidents assigned to the user, eight VIP incidents, 24 team incidents, and 10 unassigned incidents, with charts for open incidents by status and response SLA, and a table listing incidents about to breach with caller names and status updates like New, In Progress, and Pending.

Turn every conversation into an exceptional experience. Resolve issues faster, improve productivity, and save costs with the power of AI.
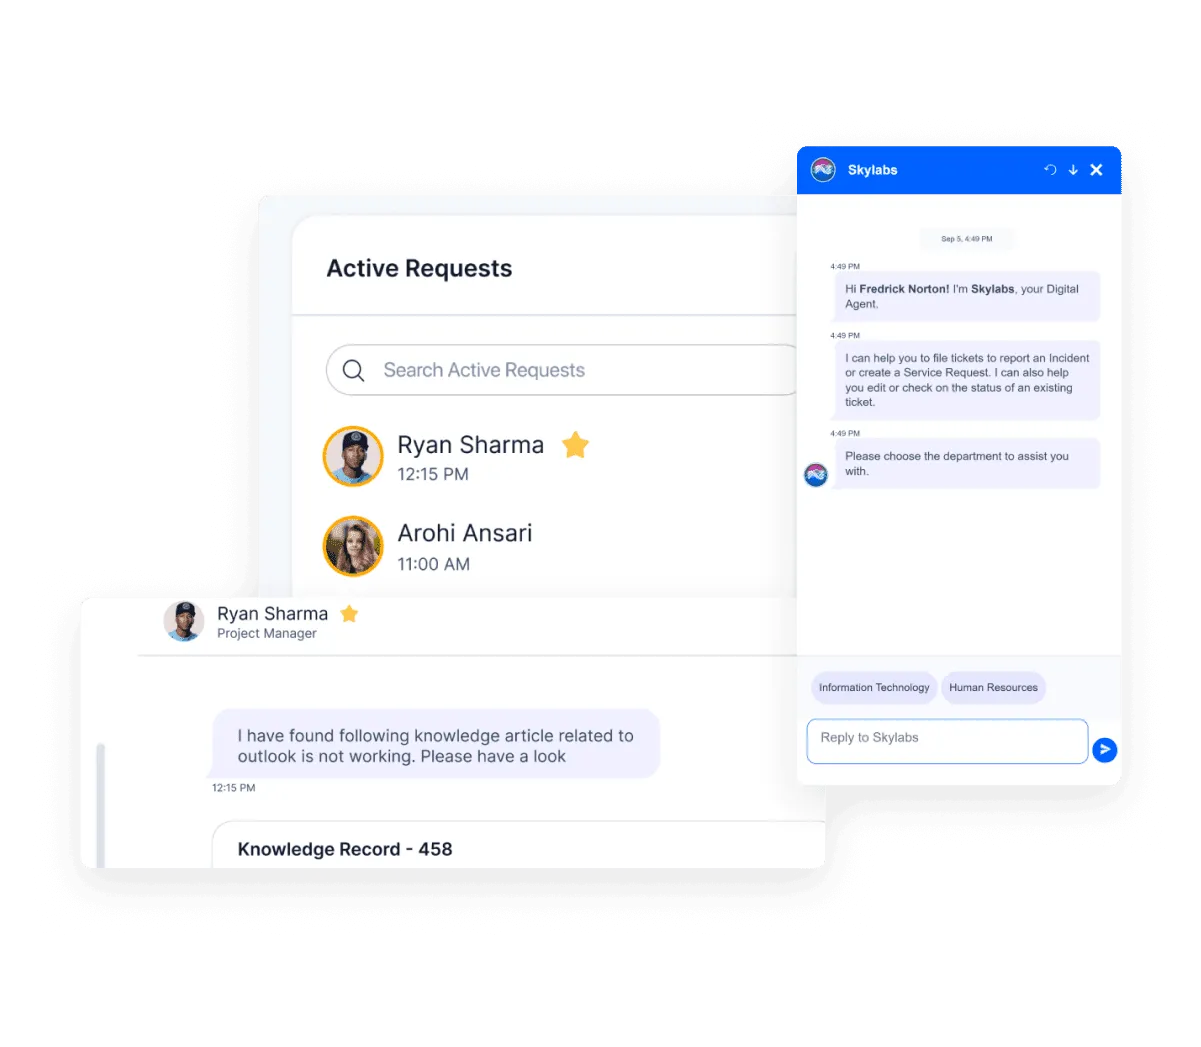
Interface showing active requests with names Ryan Sharma and Arohi Ansari and a chat window labeled Skylabs where a digital agent offers help with tickets and service requests.

Accelerate business value with automation. Automate service processes to scale faster than ever. Work smarter not harder.

Automation dashboard from SymphonyAI Summit showing workflow execution trends with graphs and charts indicating total workflows, active workflows, inactive workflows, script execution status with success and failure rates, top workflow executions, top tenants, and top categories over time.