Assortment Optimization

The right products in the right stores. Not the chain average.

AI-driven assortment optimization that tailors your product mix, shelf space, and planograms to each store cluster.

Albertsons Companies logo with a stylized letter A containing three leaves to the left and the text 'Albertsons' above 'Companies' to the right.Bold uppercase text spelling 'METRO' in a modern sans-serif font.Logo featuring the white letters 'BJ's' with a checkmark integrated into the letter 'J'.Harbor Freight logo with bold white uppercase letters and a white underline.Giant Eagle logo with stylized white text and two white leaves above the text.Logo of the word 'foodstuffs' in lowercase bold letters followed by 'NORTH ISLAND' in uppercase letters.Musgrave written in white cursive script.Logo text reading REMA 1000 in bold white letters with a black outline.SchnucksWhite text 'SYSTEM BOLAGET' inside a white octagonal border.The word 'Rimi' in bold, stylized white letters followed by two curved shapes resembling leaves or swooshes.

Most retailers optimize assortments for the chain average.

Every store gets the same range, regardless of who shops there or how much shelf space is available. The result: wasted facings on slow sellers in some stores, out-of-stocks on top sellers in others. SKU rationalization without demand modeling is guesswork. You need to know what happens when a product leaves the shelf.

White storefront icon with a striped awning.
Store-specific assortments, not chain averages

AI clusters stores by shopper behavior, demographics, and performance. Each cluster gets an optimized product mix tailored to local demand, within the shelf space actually available.

White lane splitting arrows, one solid and one dashed, diverging upward.
Know what happens before you cut a SKU

Demand transference models predict substitution and cannibalization when products are added or removed. You see the projected impact on sales and margin before making the change.

White geometric abstract design resembling the combination of letters L and F in a square shape.
Planograms generated automatically, at scale

Store-specific planograms are built from your optimized assortment, shelf dimensions, and merchandising rules. One retailer manages 7,500 planograms across 450 stores with 2-3 FTEs.

Abstract dark background with flowing curved lines in purple and pink hues creating a sense of motion.

Real outcomes, validated in production

White zigzag arrow pointing upward and to the right, symbolizing growth or increase.
+4.6% sales, +5.2% margin
at Leading UK Co-operative Retailer across categories including soft drinks, baby, and snacking.
Two white arrows pointing in opposite directions: one arrow points right above the other pointing left.
175+ convenience stores
replaced a legacy on-premise solution with CINDE Assortment Optimization.
Simple white clock icon showing the time as 1:25.
17,000 hours saved
annually at Systembolaget (Sweden). 7,500 planograms across 450 stores managed by 2-3 FTEs, with quarterly update cycles completed in 5-6 weeks.
Icon representing a shelving unit with two shelves, each with a box-like object sitting on it.
300+ planograms personalized
at Foodstuffs (New Zealand), developed through a joint PepsiCo-SymphonyAI clustering project. "We grouped stores into shopper-led clusters and optimized each shelf to match." (Jan Haluza, Manager, Data Science and Analytics, PepsiCo Europe)
White dollar sign symbol.
+8% incremental sales
lift at PepsiCo Northern Europe
Circular refresh icon with two white arrows forming a circle around a white check mark, symbolizing successful update or synchronization.
35% faster shelf reset execution
AI-driven planogram automation replaced static planograms at 96% market penetration across 1,000+ retail locations
What is assortment optimization in retail?

Assortment optimization is the process of selecting the right product mix for each store or store cluster based on local demand, available shelf space, and financial targets. AI-driven approaches use demand transference models to predict what happens when products are added or removed, replacing manual spreadsheet-based range reviews.

How does AI improve SKU rationalization?

Traditional SKU rationalization cuts slow sellers without modeling what happens next. AI predicts substitution and cannibalization effects, so you know the projected impact on sales, margin, and customer satisfaction before making changes.

What is the difference between assortment optimization and space planning?

Assortment optimization decides which products need to be carried in each store. Space planning decides where they need to be placed on the shelf and how much space they get. The best results come when both are connected: the assortment is optimized within the space actually available.

Stop optimizing for the average store.
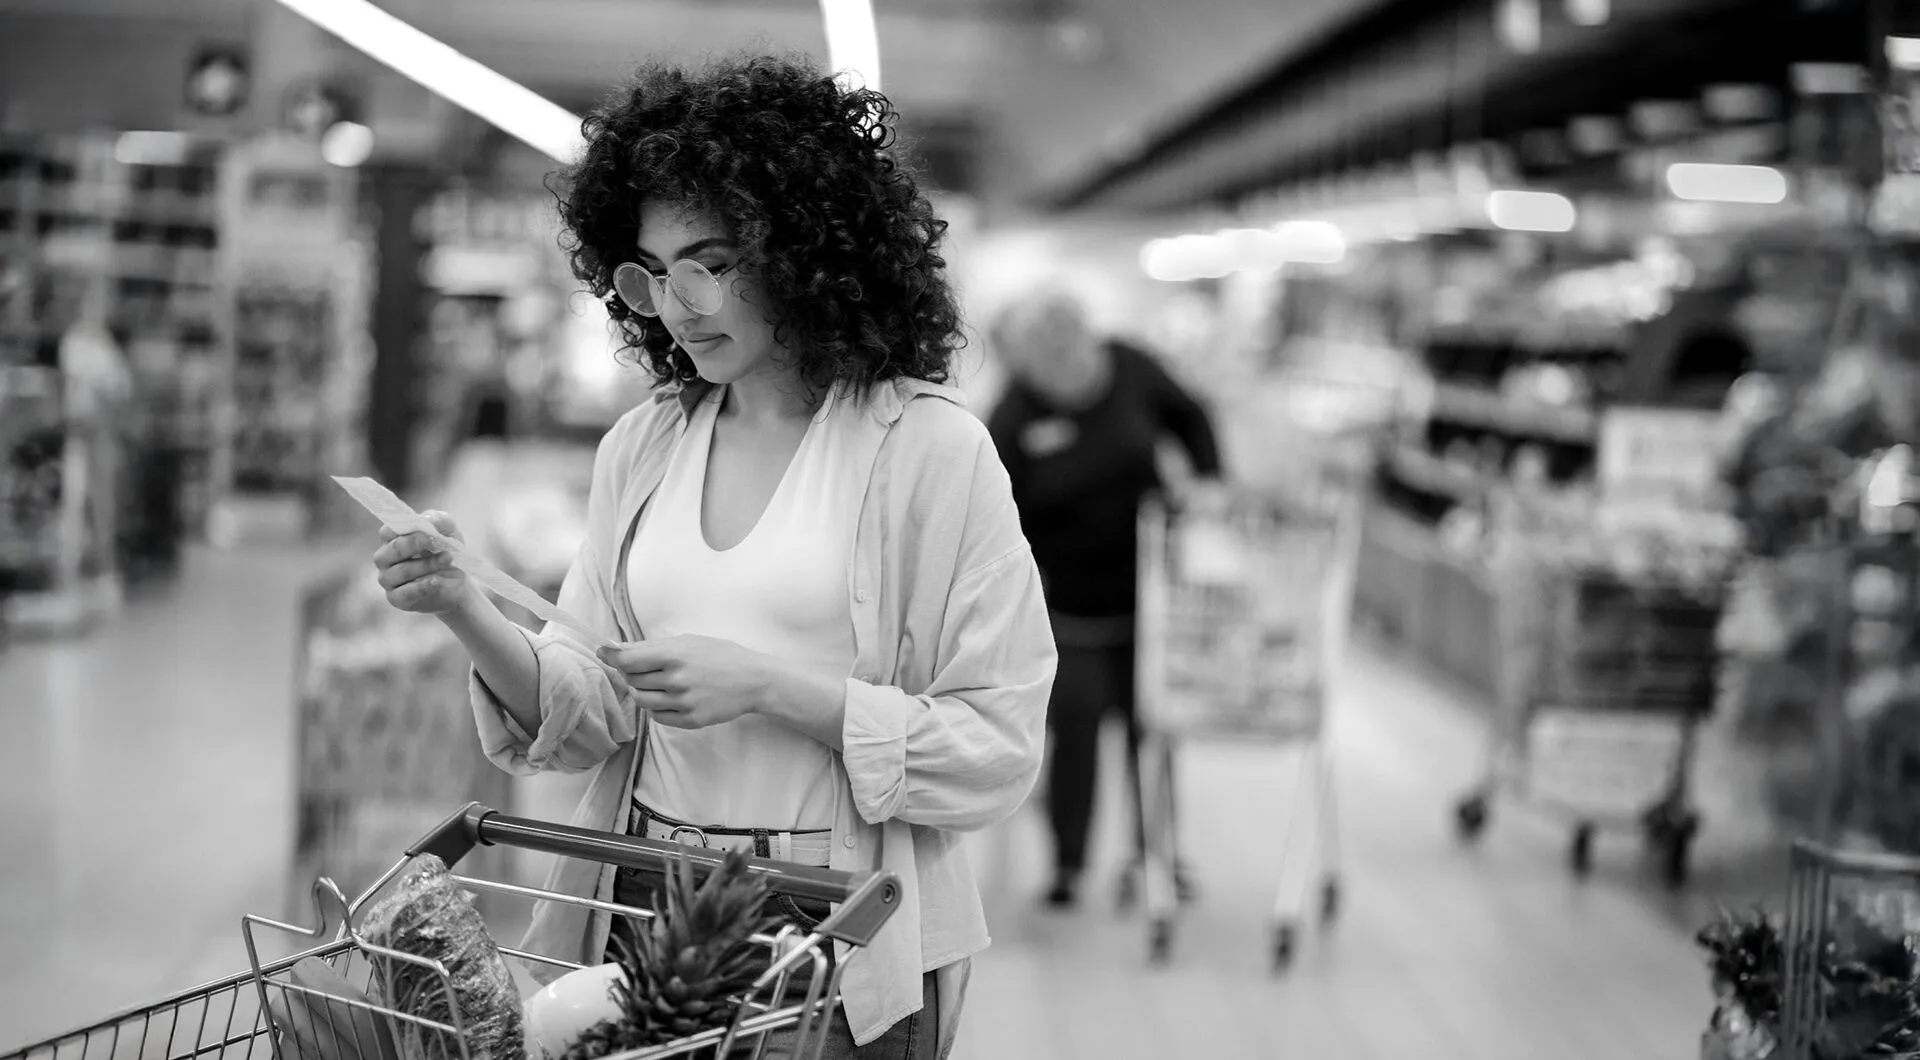
Woman with curly hair and glasses looking at a receipt while standing in a grocery store aisle with a shopping cart containing a pineapple and other items.