Detection designed to adapt

Stay ahead of evolving criminal behavior with advanced machine learning and predictive AI

A large translucent pale blue gradient circle on the right side fading into white.
Screenshot of SymphonyAI interface showing a data table of algorithm evaluation metrics including ID, algorithm, validation, ROC, precision, recall, FP:TP, F1, F2, and F0.5 scores with color-coded cells. A pop-up window titled 'Welcome!' invites users to take a tour on how SymphonyAI auto-hibernates false positives and prioritizes real risk, with Back and Next buttons visible.

Interactive demo

See how you can reduce false positives and prioritize real risk with advanced machine learning.

Color-coded performance metrics table showing ROC curves and values for Precision, Recall, FP:TP, F1, F2, F0.5, MCC, and AUC across different models or settings, with a Parameters panel listing Decision Boundary F-Score Beta as 50 and Boosting Type as DART.

Expose risk that others miss

Uncover hidden risk patterns and complex anomalies in transactions with AI-driven scoring that significantly enhances detection
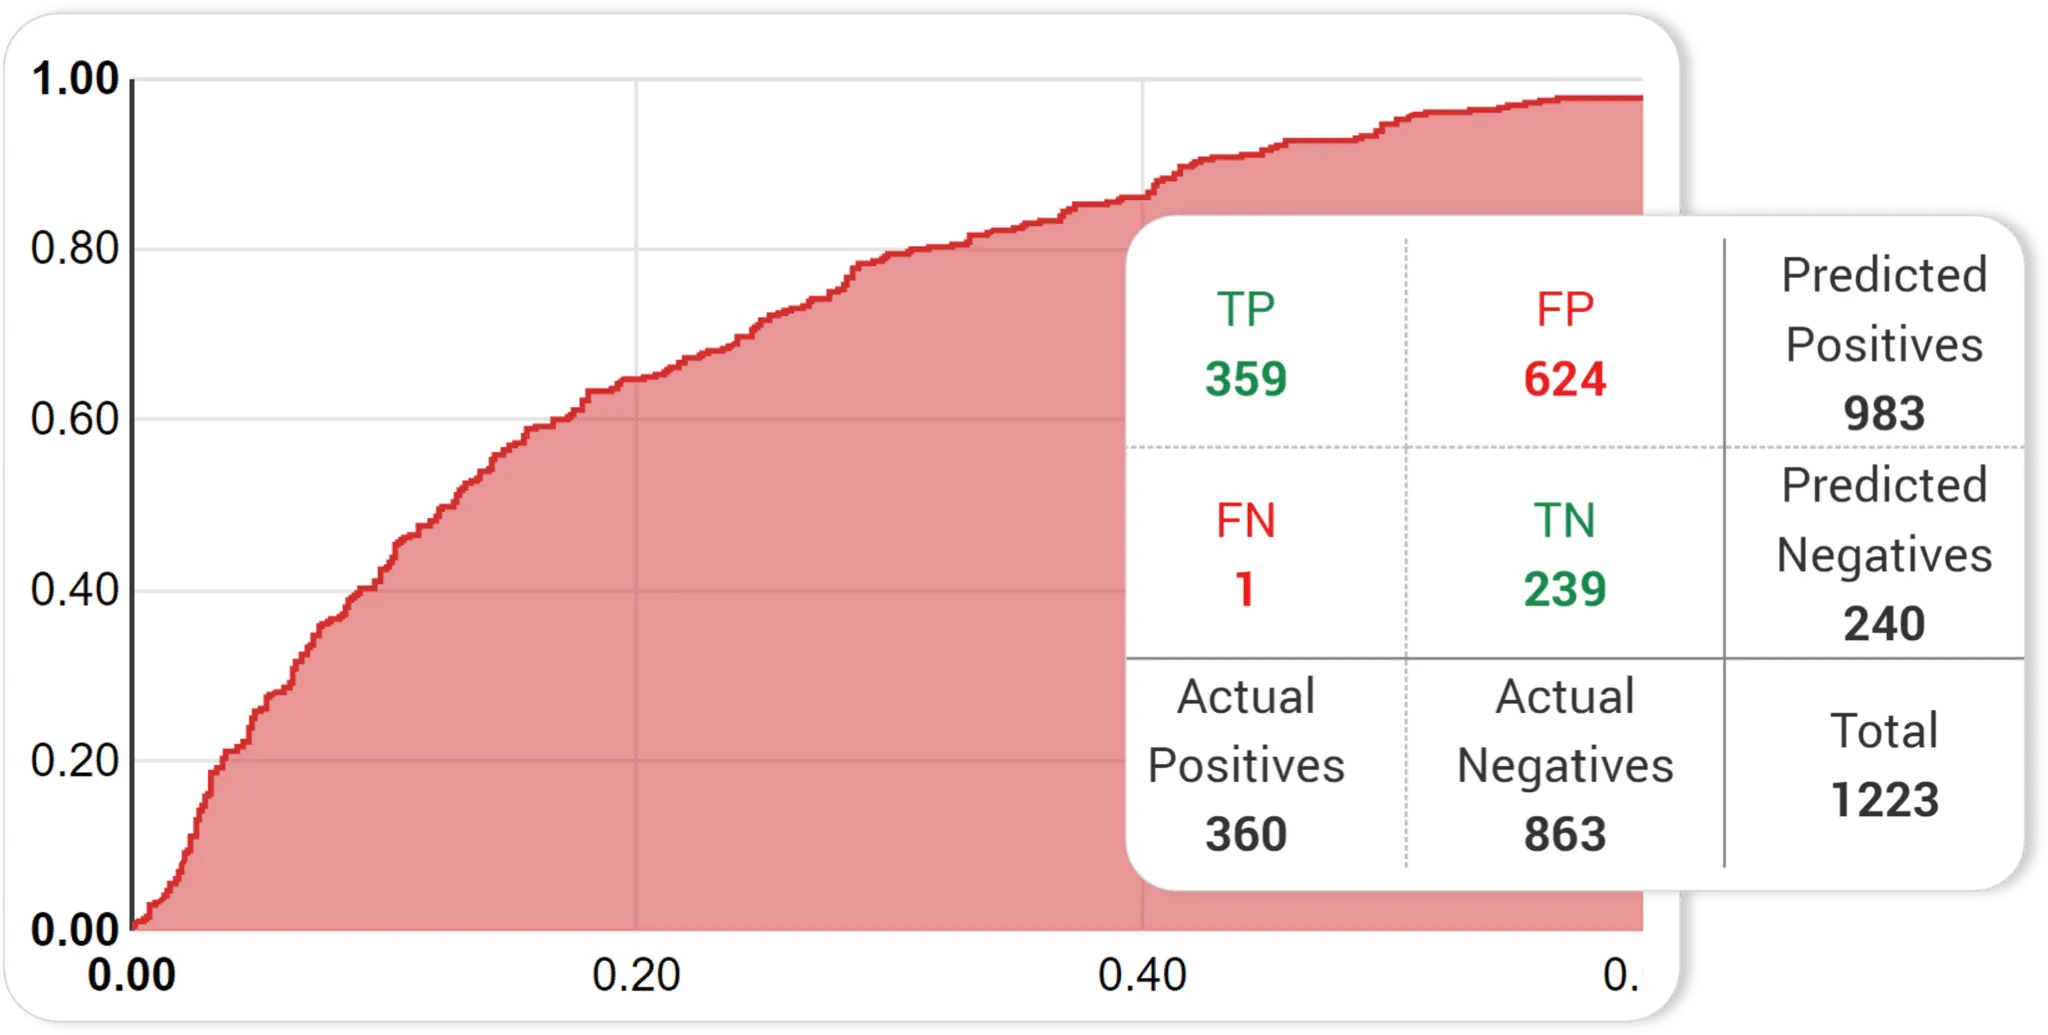
ROC curve graph shaded in red showing trade-off between true positive and false positive rates, with an embedded confusion matrix displaying 359 true positives, 624 false positives, 1 false negative, 239 true negatives, totaling 1223 samples.

Reduce false positives by 70%

Visualize past performance of detection models and run simulations of updated rules to significantly decrease false positive alerts
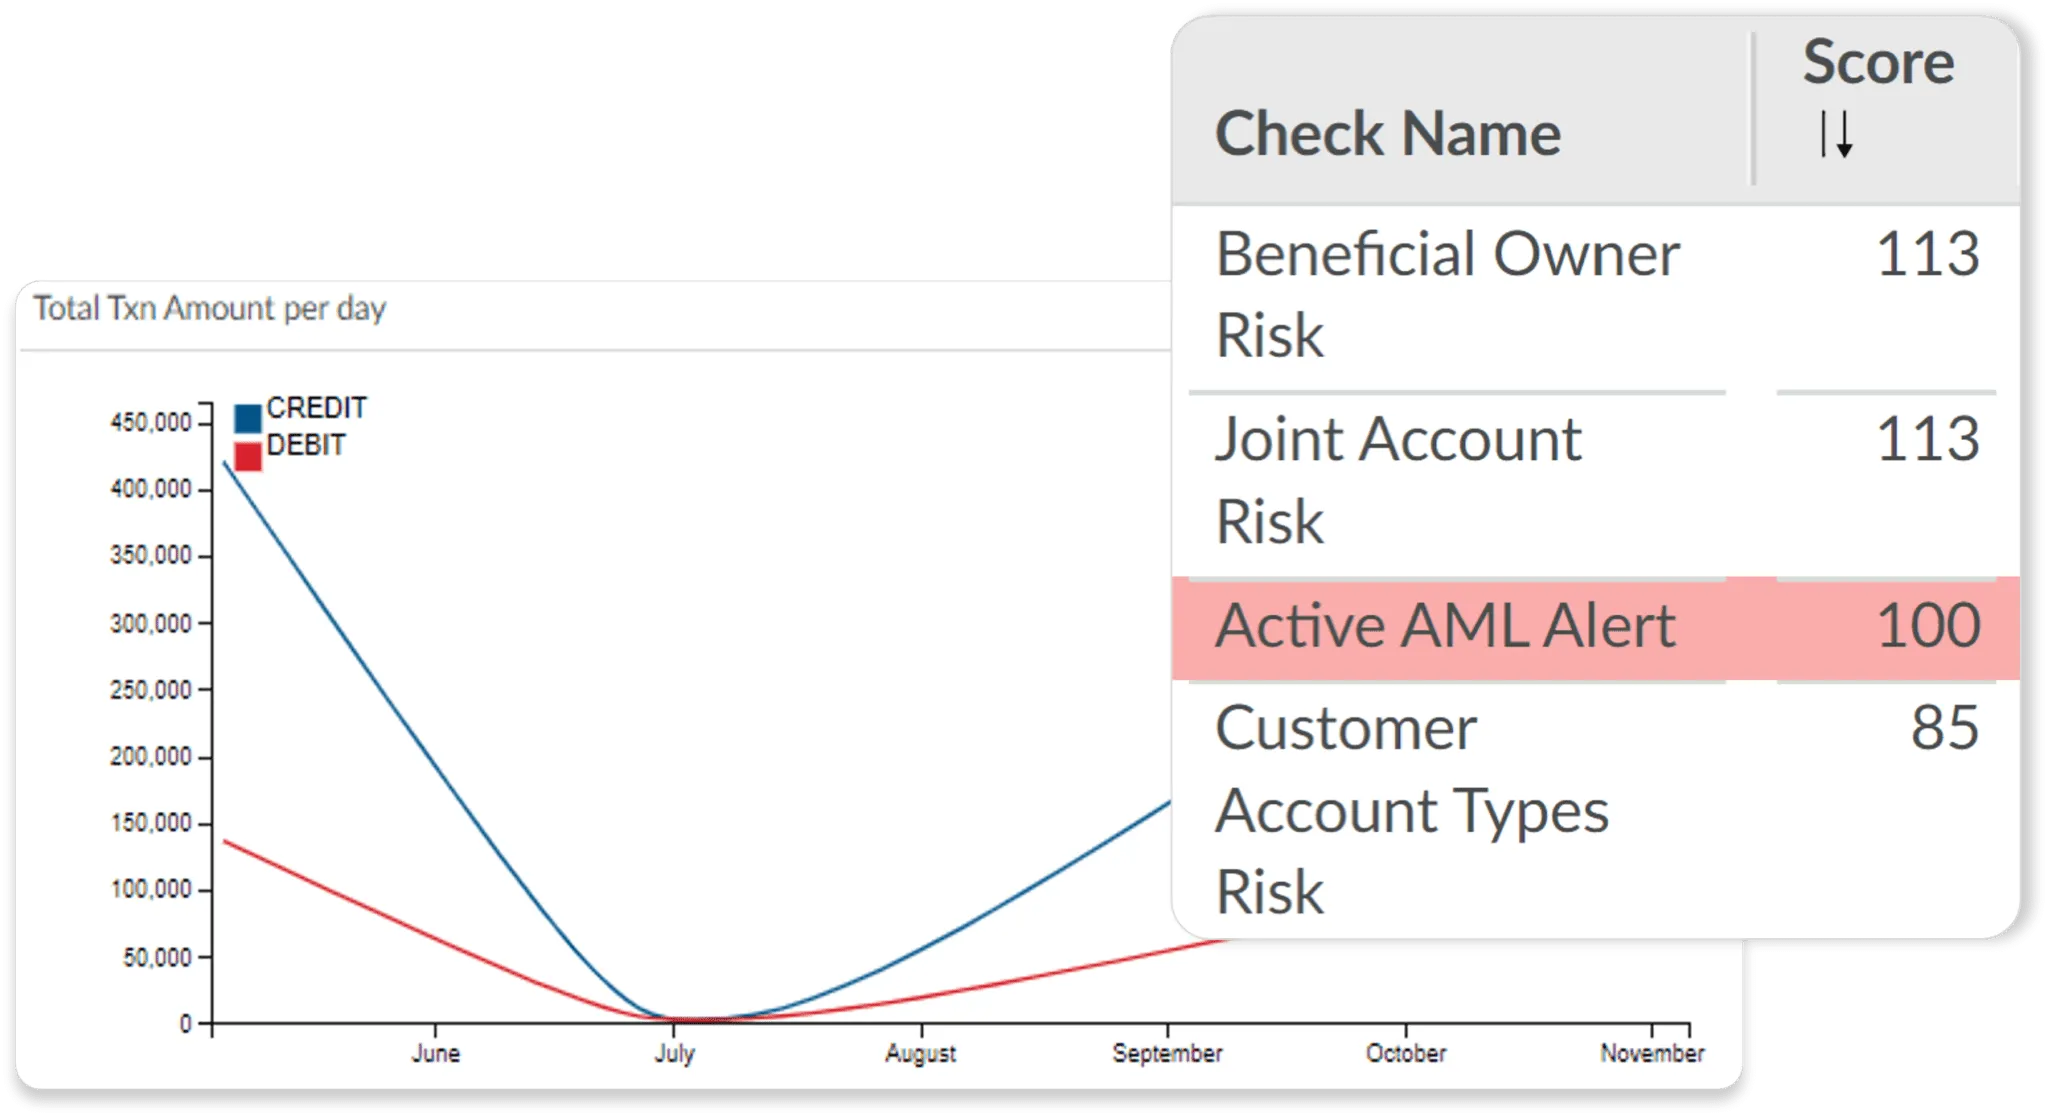
Line graph showing total transaction amounts per day from June to November for credit and debit, with credit transactions starting near 425,000 and debit at 140,000 before dipping near zero in July and rising again. An overlay table lists risk check names and scores, including Beneficial Owner Risk 113, Joint Account Risk 113, Active AML Alert 100 highlighted in red, and Customer Account Types Risk 85.

Risk assess behavior change in real-time

Constantly monitor behavior with advanced machine learning algorithms that trigger alerts when suspicious changes are detected.

User interface screen titled Configuration 1001 showing tabs for Data Labels, Profiling, Models, Detection, Parameters, and Overview. The Profiling tab is selected. In the Customer entity dropdown, several expandable records are listed, including Transaction record, IUCustomer record, and SensaCustomerScore record. A Query Builder panel shows options such as Data fields, Data labels, and General. Zoomed-in popups highlight the Domain set to 'AML - Suspicious Activity' and Status marked as 'In production' with a green square.

Self-service analytics

Enable in-house teams to create, configure, and fine-tune detection models, keeping your risk management strategy agile and cost effective.

Diagram showing Duran Enterprises at the center connected by labeled arrows to related entities and individuals. Connections include share ownership with PGL Group and Allistair Woodsworth; ownership and beneficiary links to Peter Gadet and David Elliot; main subject links to several flagged entities labeled CDDRT2023121546949, A2023110821849, and A2023103161730; and a main link to Duran Enterprises and a secondary link to Peter Gadet-Leroux. Icons representing people, groups, and organizations accompany each node.
Entity Resolution

Resolve every data point

Transform billions of siloed data points into a unified customer view to take your detection and investigation capabilities to the next level.

Discover more features and functionality of AML Transaction Monitoring

Soluton Benefits

Reduce exposure to risk

Identify and mitigate hidden risks that others may overlook thanks to advanced ML and AI models.

Reduce false positives

Significantly decrease false positive alerts, saving valuable time and resources.

Improve investigator efficiency

Streamline operations, automate manual tasks, and provide a holistic view of risk.

Future-proof compliance

Stay ahead of evolving regulatory requirements and industry standards with advanced AI.