Integrated Data Decisioning

Unleash the power of connected data

Advanced decision science and data management solutions empowering you to identify and act on actionable insights that drive collaboration and growth
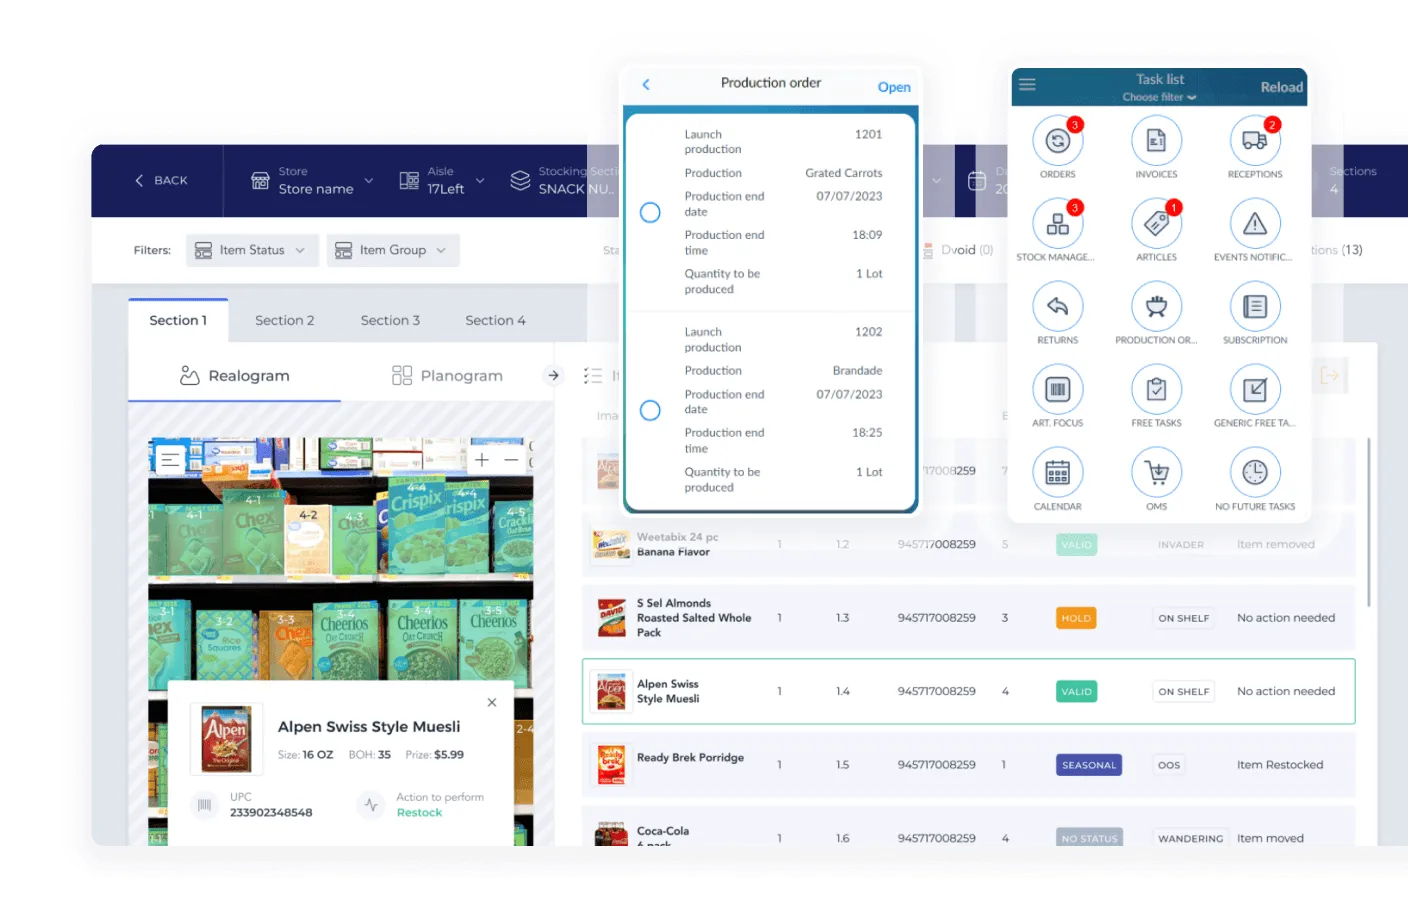
Real-time insights

Gain a comprehensive understanding of the business with real-time, connected business insights.

Predictive analytics and prescriptive recommendations

Foster collaboration, spark innovation, and drive timely, impactful business decisions.

Empower retail growth

Turn your data into an asset to create business opportunities that enhance your bottom-line.

Yellow and orange gas station with multiple fuel pumps and a convenience store in the background, a silver car refueling, and a car side mirror in the foreground showing fuel options.Man in a denim shirt standing in front of a pharmacy shelf, reading the label on a medicine box.Smiling woman wearing a red beanie and beige coat holding a blue product box in one hand and using a smartphone with the other in a store aisle filled with various products.
Fuel Retail Analytics
Bold black downward pointing chevron arrow.

Maximize pump-to-store conversions by analyzing how and where customers interact within your fuel retailing sites and loyalty programs

Retail Pharmacy Analytics
Bold black downward pointing chevron arrow.

Seamlessly integrate front store (OTC) and Rx sales and operations data, ensuring both security and peace of mind for patient confidentiality leveraging SymphonyAI’s HIPAA-compliant solution.

Consumer Insights Platform
Bold black downward pointing chevron arrow.

Facilitate confident decision-making and deep understanding of all components of your business through a single harmonized platform.

Connected data

Simplified data management produces valuable insights your entire organization can use. Manage structured and unstructured retailer, CPG, and third-party data.
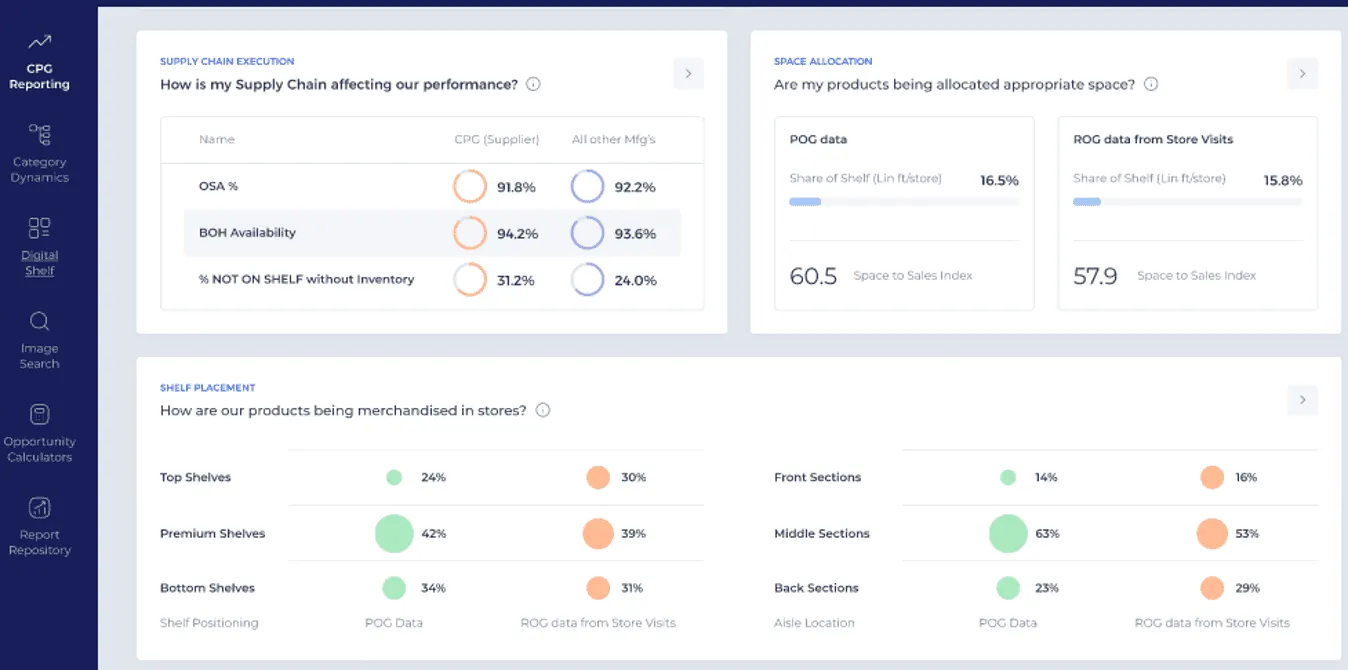
Proven AI models analyze data across the enterprise to understand what happened and why, predict what will happen, and provide recommendations that create pathways to new growth.

Explore new revenue streams and extract maximum value from your data and insights. Provide a collaboration platform for better joint planning with suppliers.

Illustration with a blue person wearing a tie topped with a dollar sign, a blue clock, a turquoise gear, and turquoise binary code above them.
Manage structured and unstructured retailer, CPG, and third-party data
Diagram with six turquoise nodes arranged in pairs connected by straight lines, with three blue curved arrows indicating cyclical movement among them.
Customize data refreshes with near real-time updates, daily synchronization, and proactive notifications
Blue document with lines representing text and a folded corner, accompanied by a shield icon indicating data protection or security.
Govern data access securely through role-based permissions
Blue bar chart with three ascending bars from left to right and a translucent turquoise line graph with circular points rising over the bars, representing data growth and analytics.
Create development- and analysis-ready datasets for integration and better collaboration
A blue open book with three connected nodes above it and three light blue circular arrows forming a clockwise cycle around the book and nodes.
Connect shopper, merchandising, space, and supply chain data to break down siloes
Illustration of a storefront with a striped awning and a digital dashboard showing a bar chart with an upward arrow indicating increasing sales or growth.
Identify new trends with real-time visibility to shopper, shelf, and supply chain data
Blue silhouette of a human head with a white person icon inside, accompanied by a light blue gear to the left and gender symbols above and at the front indicating male and female.
Make smarter adjustments with proactive prescriptive insights and analytics
Blue circle with white dollar sign in center connected to two turquoise gears by lines, symbolizing financial operations or system integration.
Quickly triage and stem disruptions
Icon of a person wearing a tie with branching diagrams extending from both sides, symbolizing management or organization flow.
Create a single version of the truth to bolster collaboration between you and suppliers
Stylized browser window with chart line showing growth and a dollar sign, representing sales or financial analytics.
Monetize sales, supply chain, merchandising, store, customer data, and insights
Blue shield with a white heart in the center, accompanied by a teal padlock on the left, a teal check mark on the right, and overlapping blue and teal gears at the bottom center.
Strengthen compliance and accountability with suppliers with mutually agreed-upon metrics and monitoring
Magnifying glass with a dollar sign inside overlapping two upward trending line graphs with nodes, symbolizing financial analysis or market growth.
Customize subscription offerings that directly align with your data value and revenue objectives
Stacked translucent blue plastic plates arranged in a fanned curve against a light background.