Simplify global compliance
Stay one step ahead of ever-changing regulatory requirements

Ongoing compliance
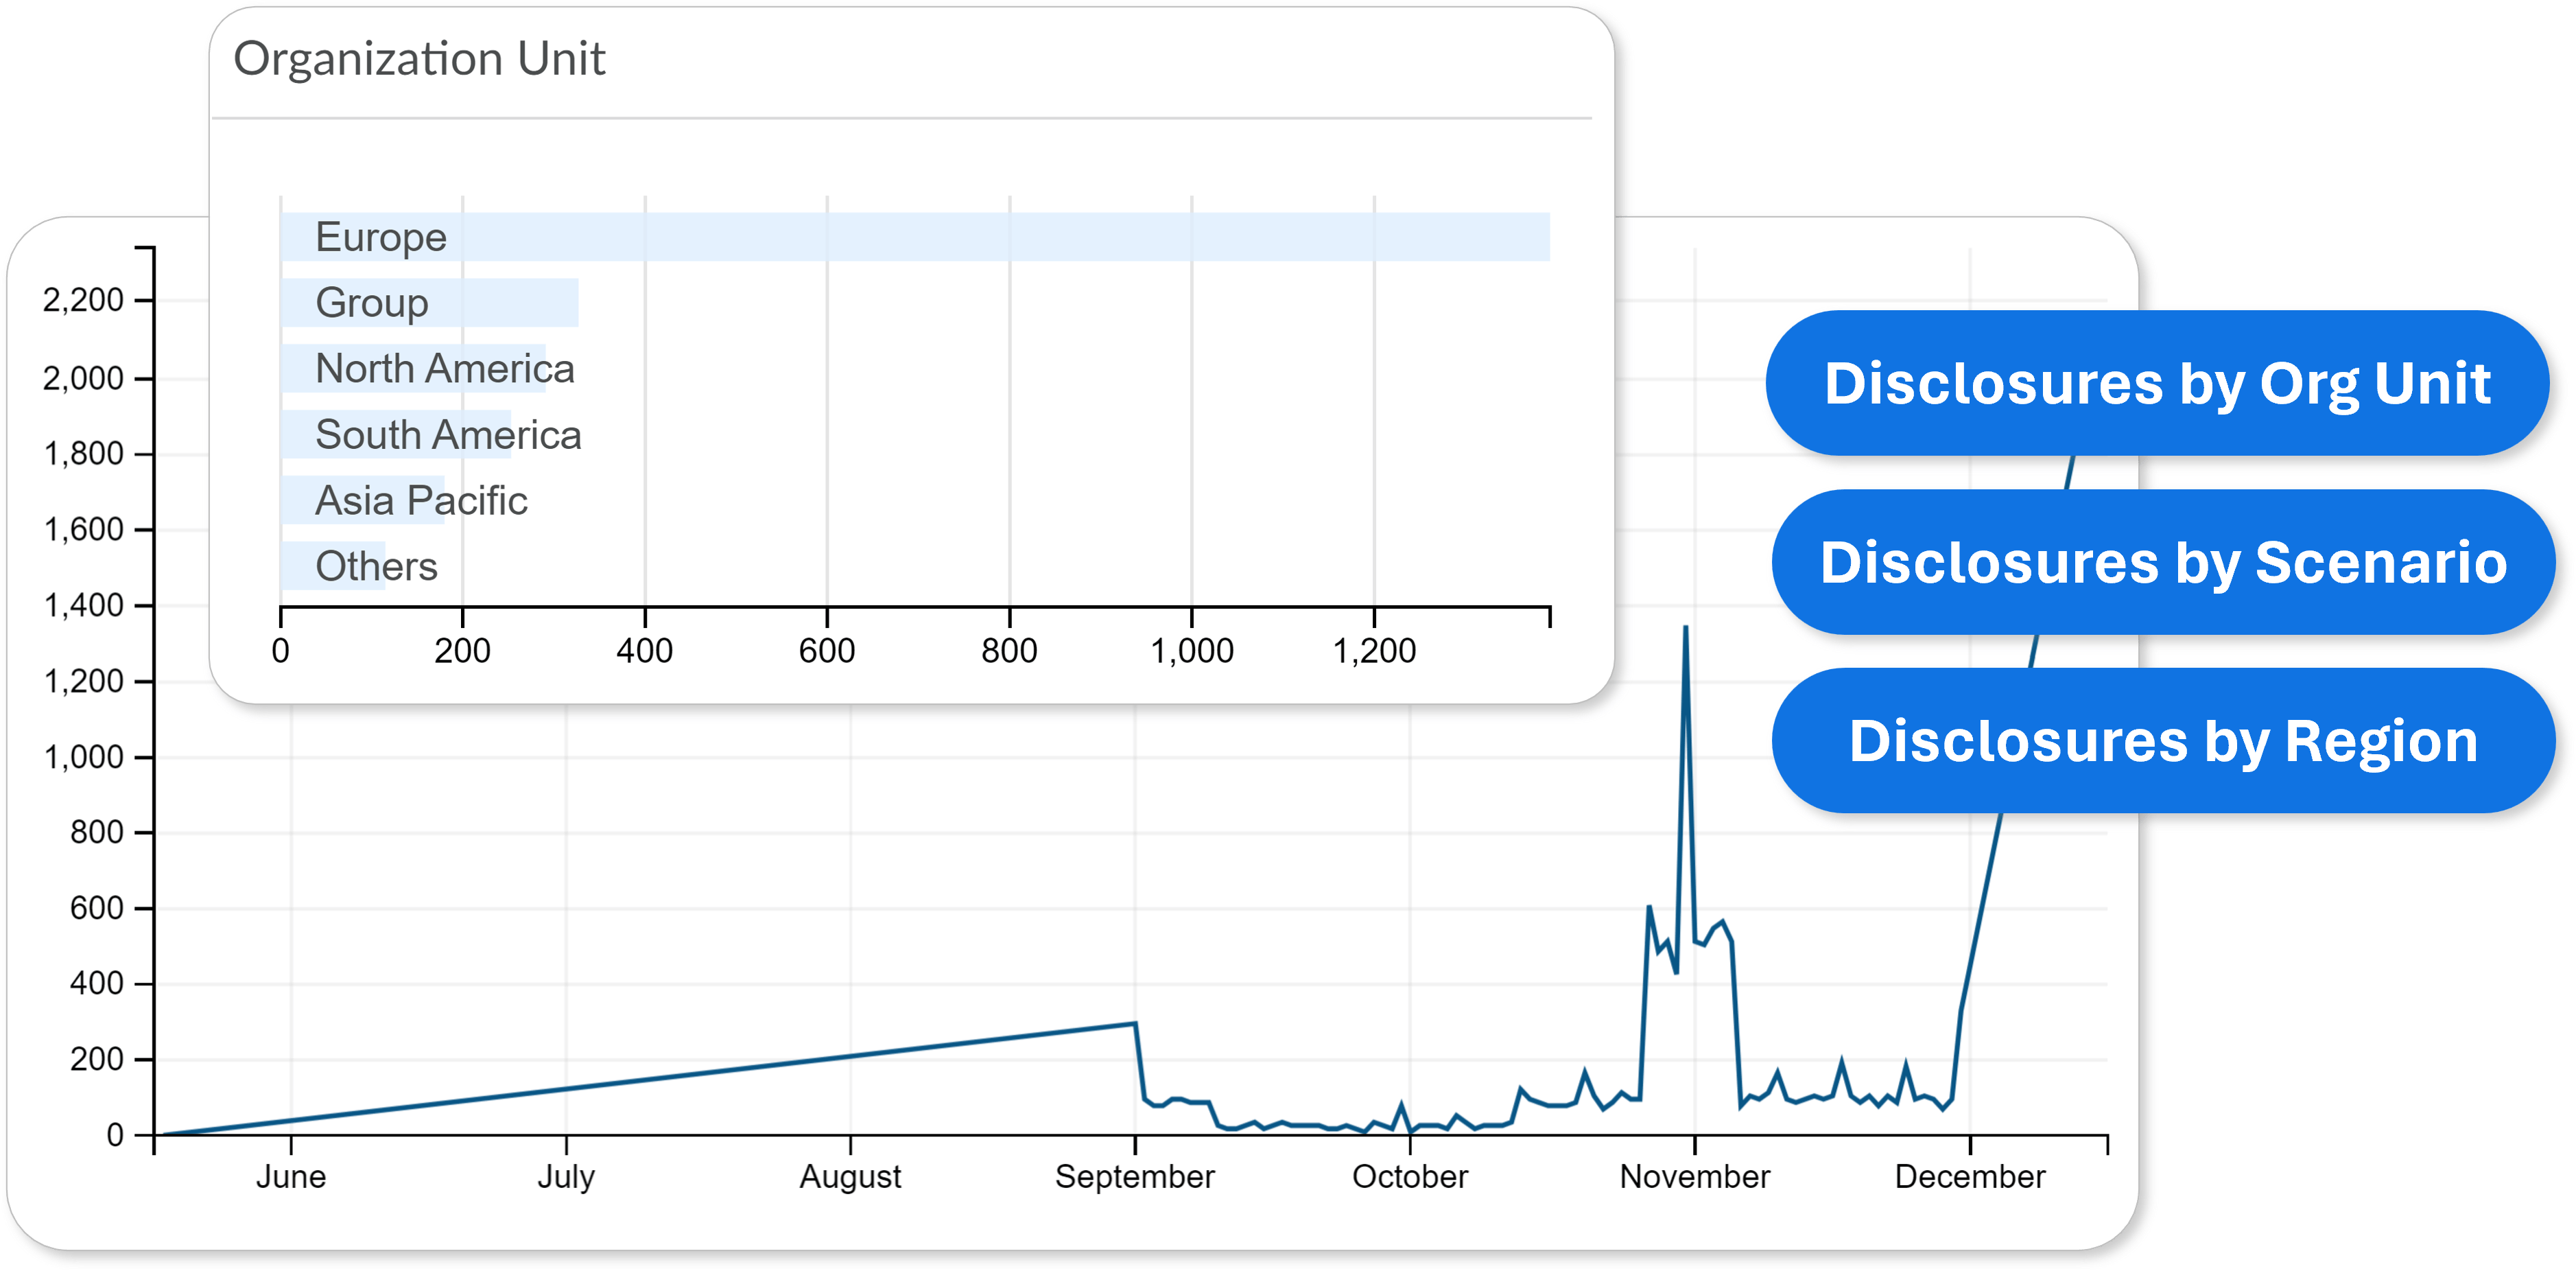
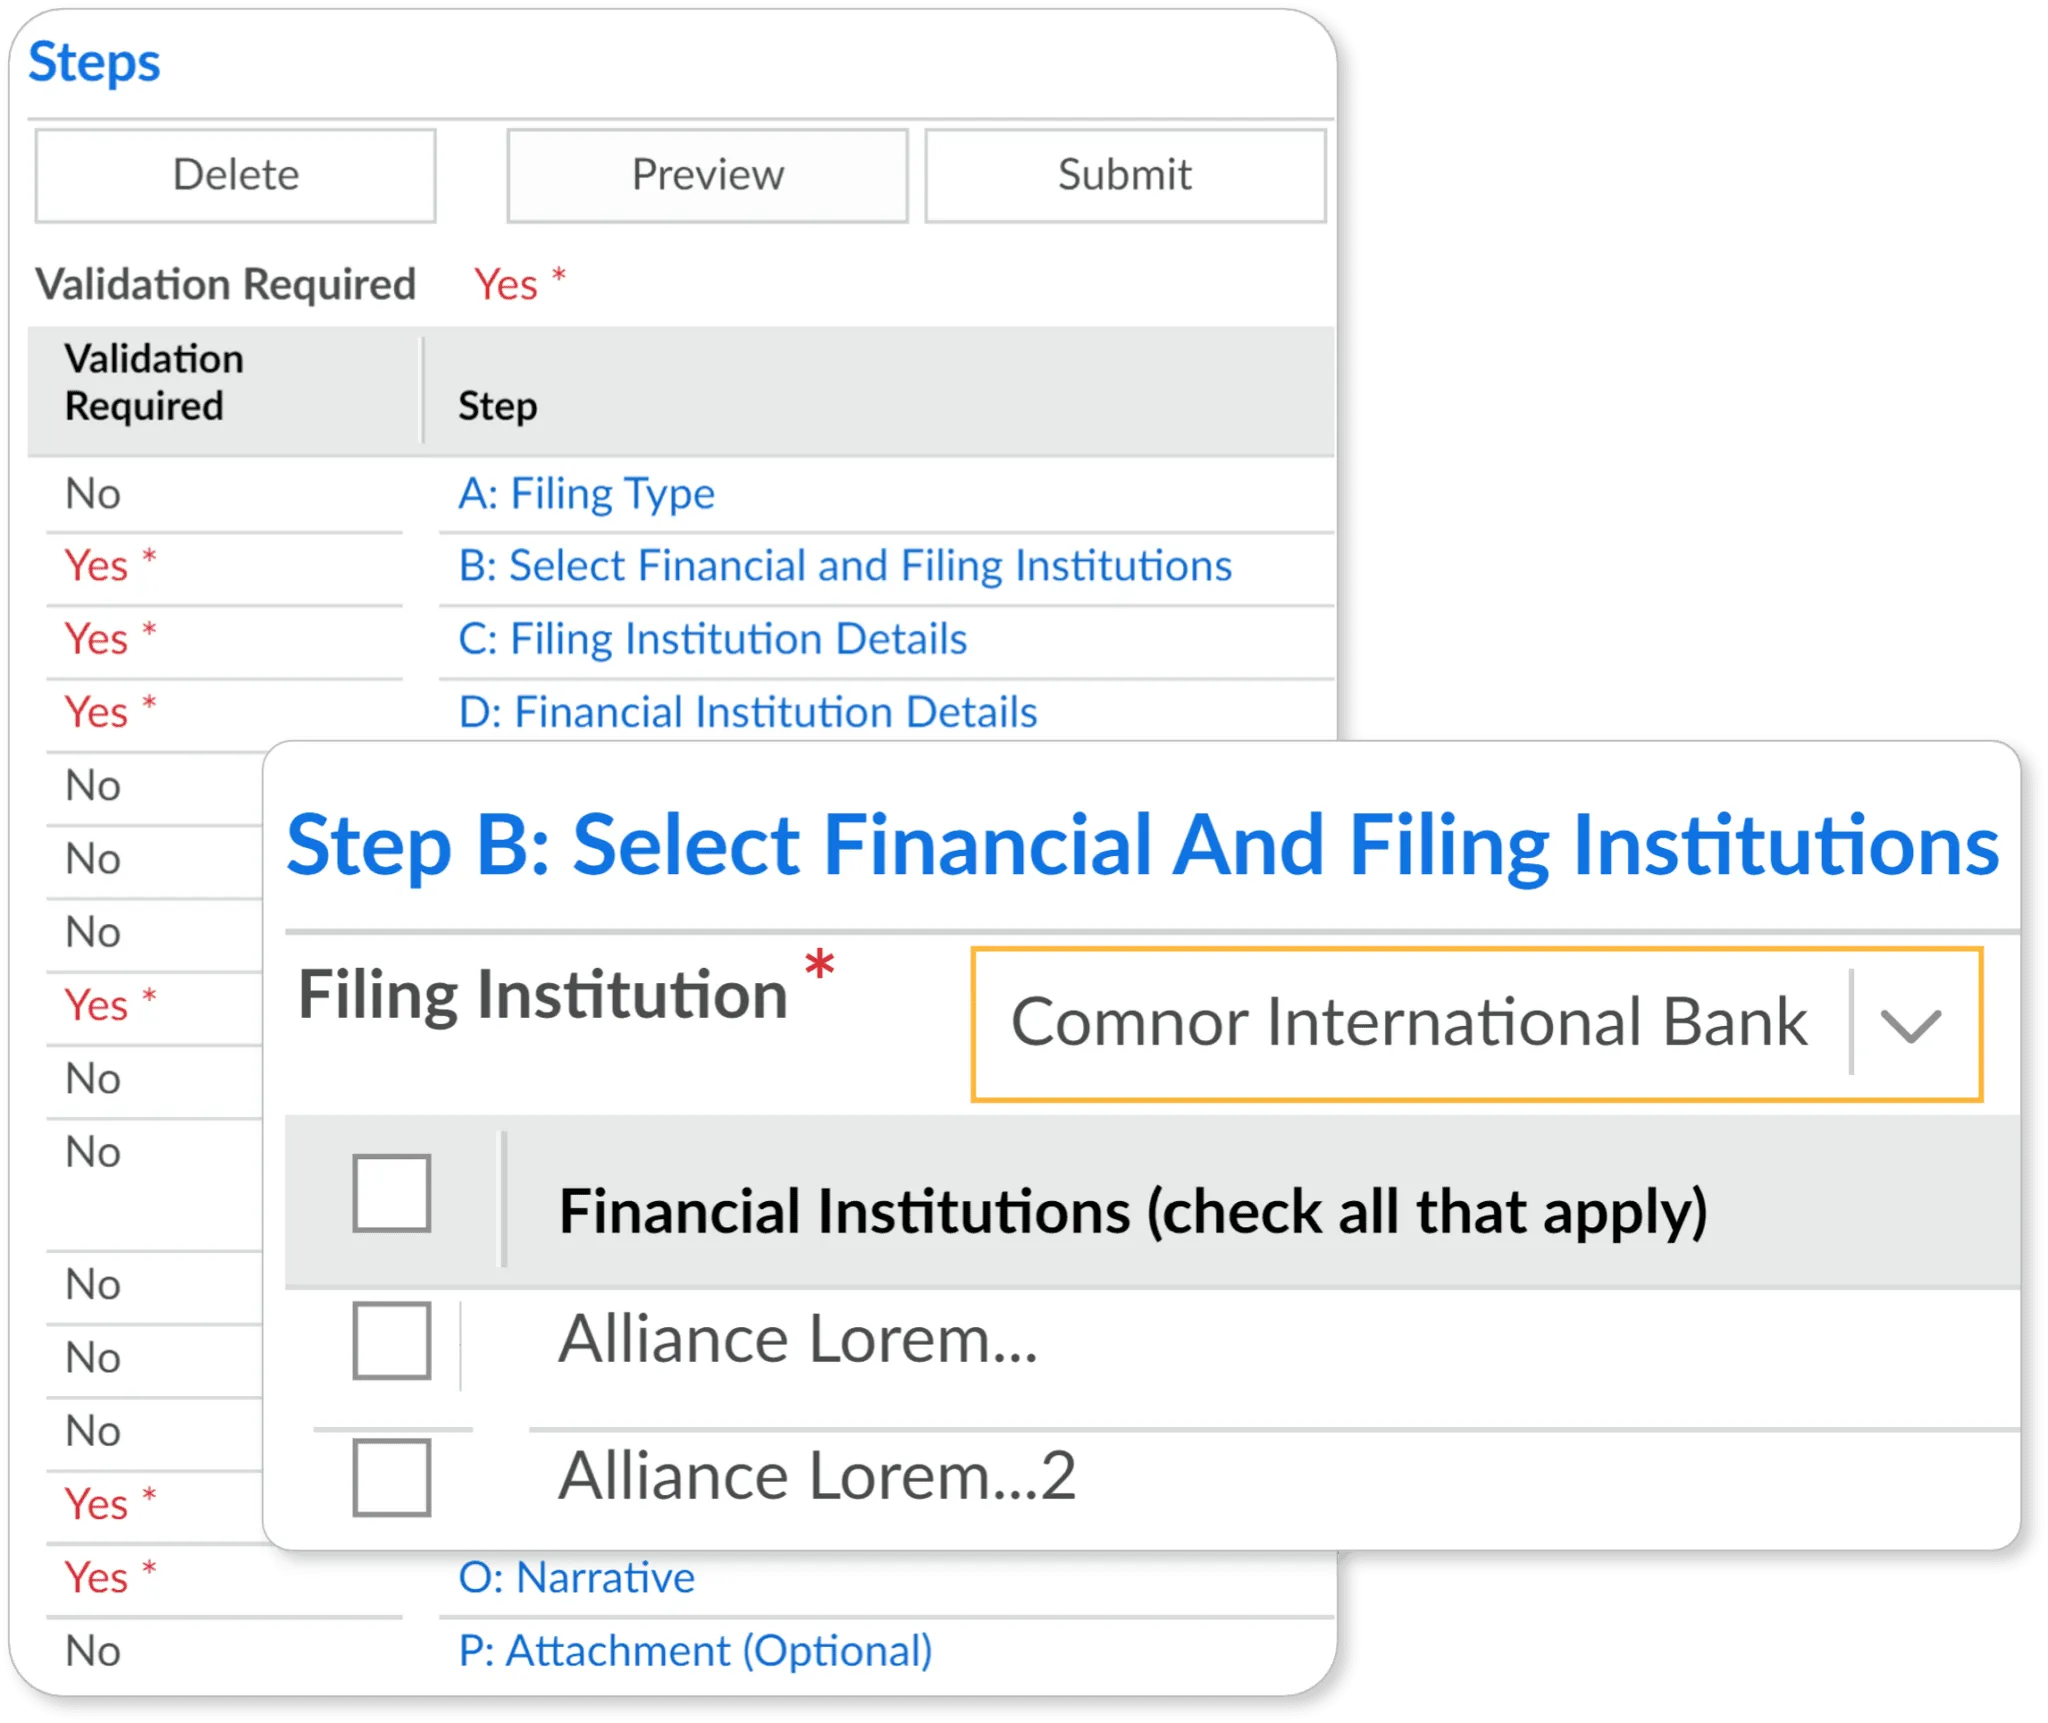
From initial onboarding and monitoring to Enhanced Due Diligence (EDD), access auditable workflows and easily adjustable risk thresholds to align with evolving regulatory mandates.
Automate SAR creation
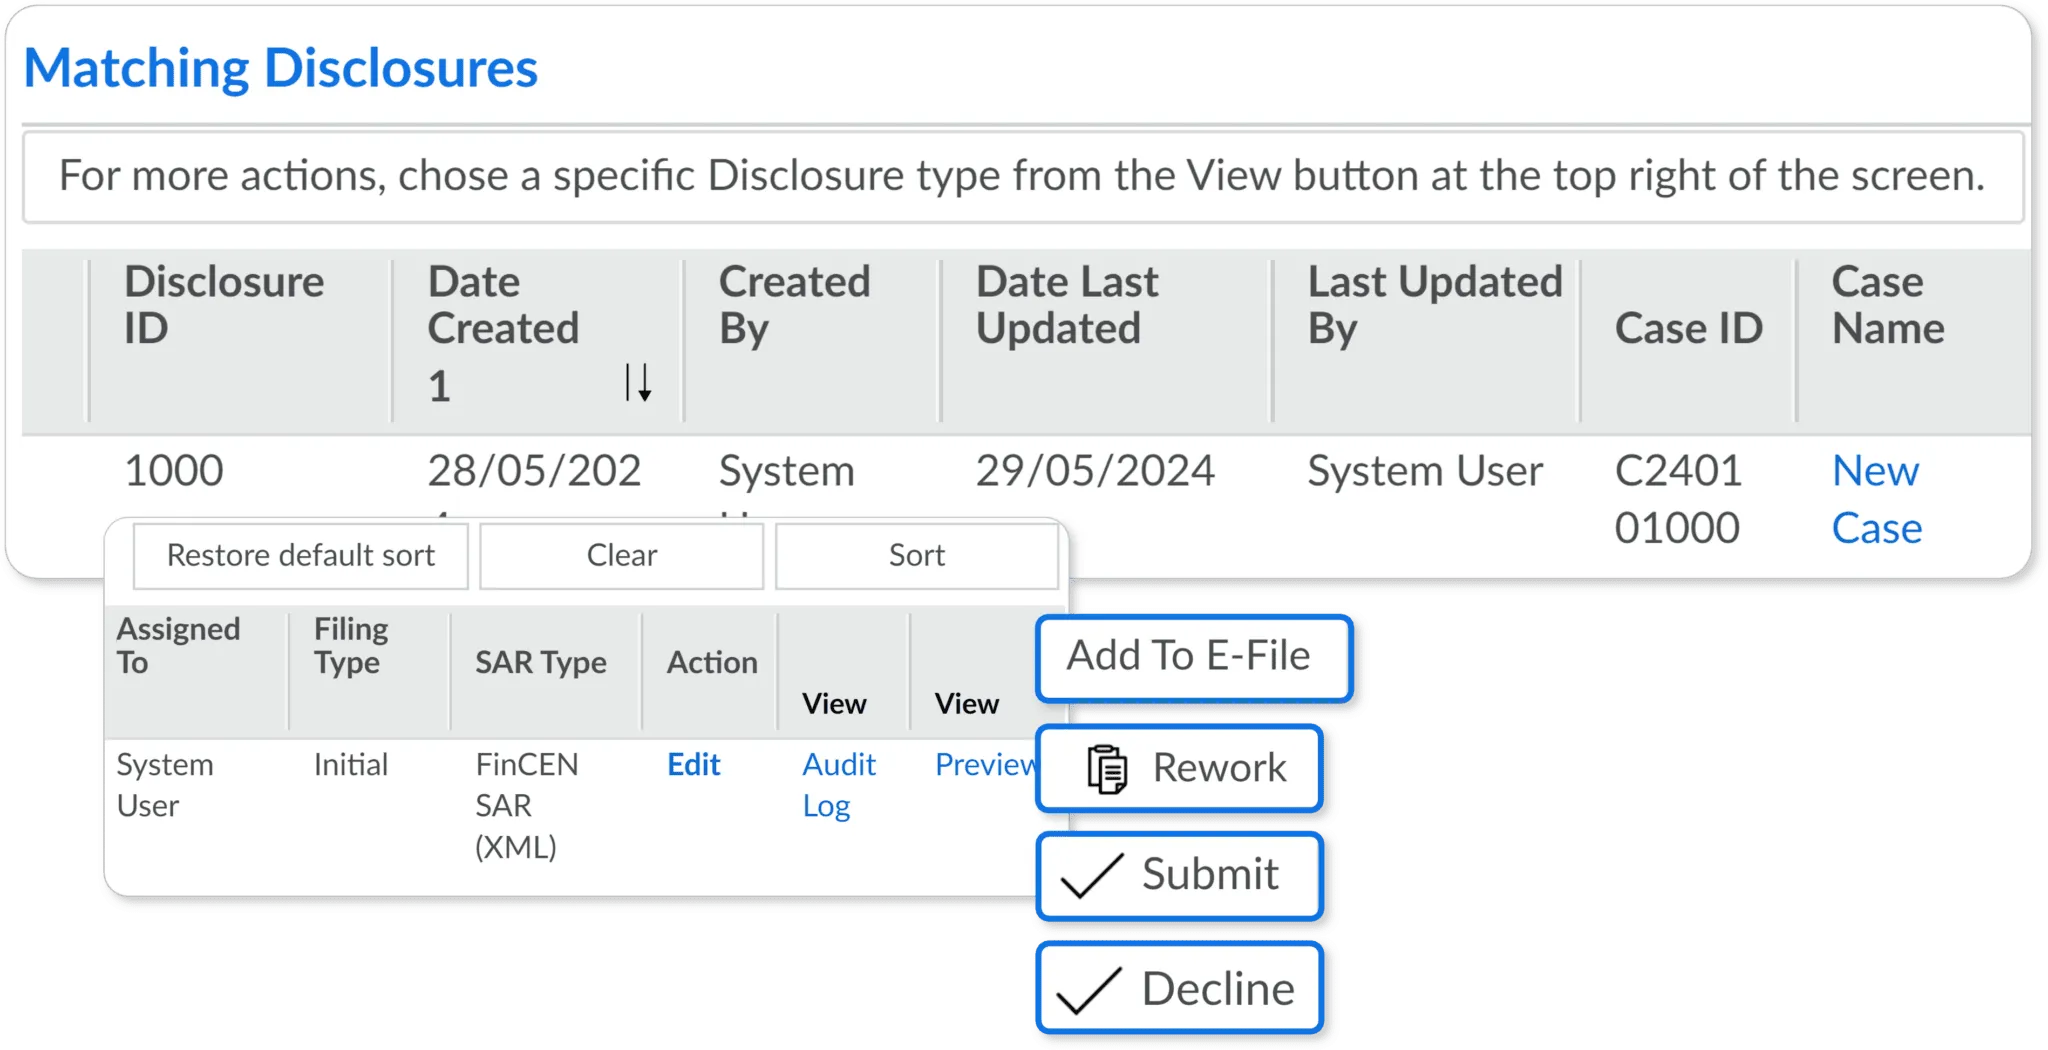
Take the hassle out of disclosures with SAR templates auto-populated with key case information, such as customer details, account and transaction summaries.
Provide superior explainability
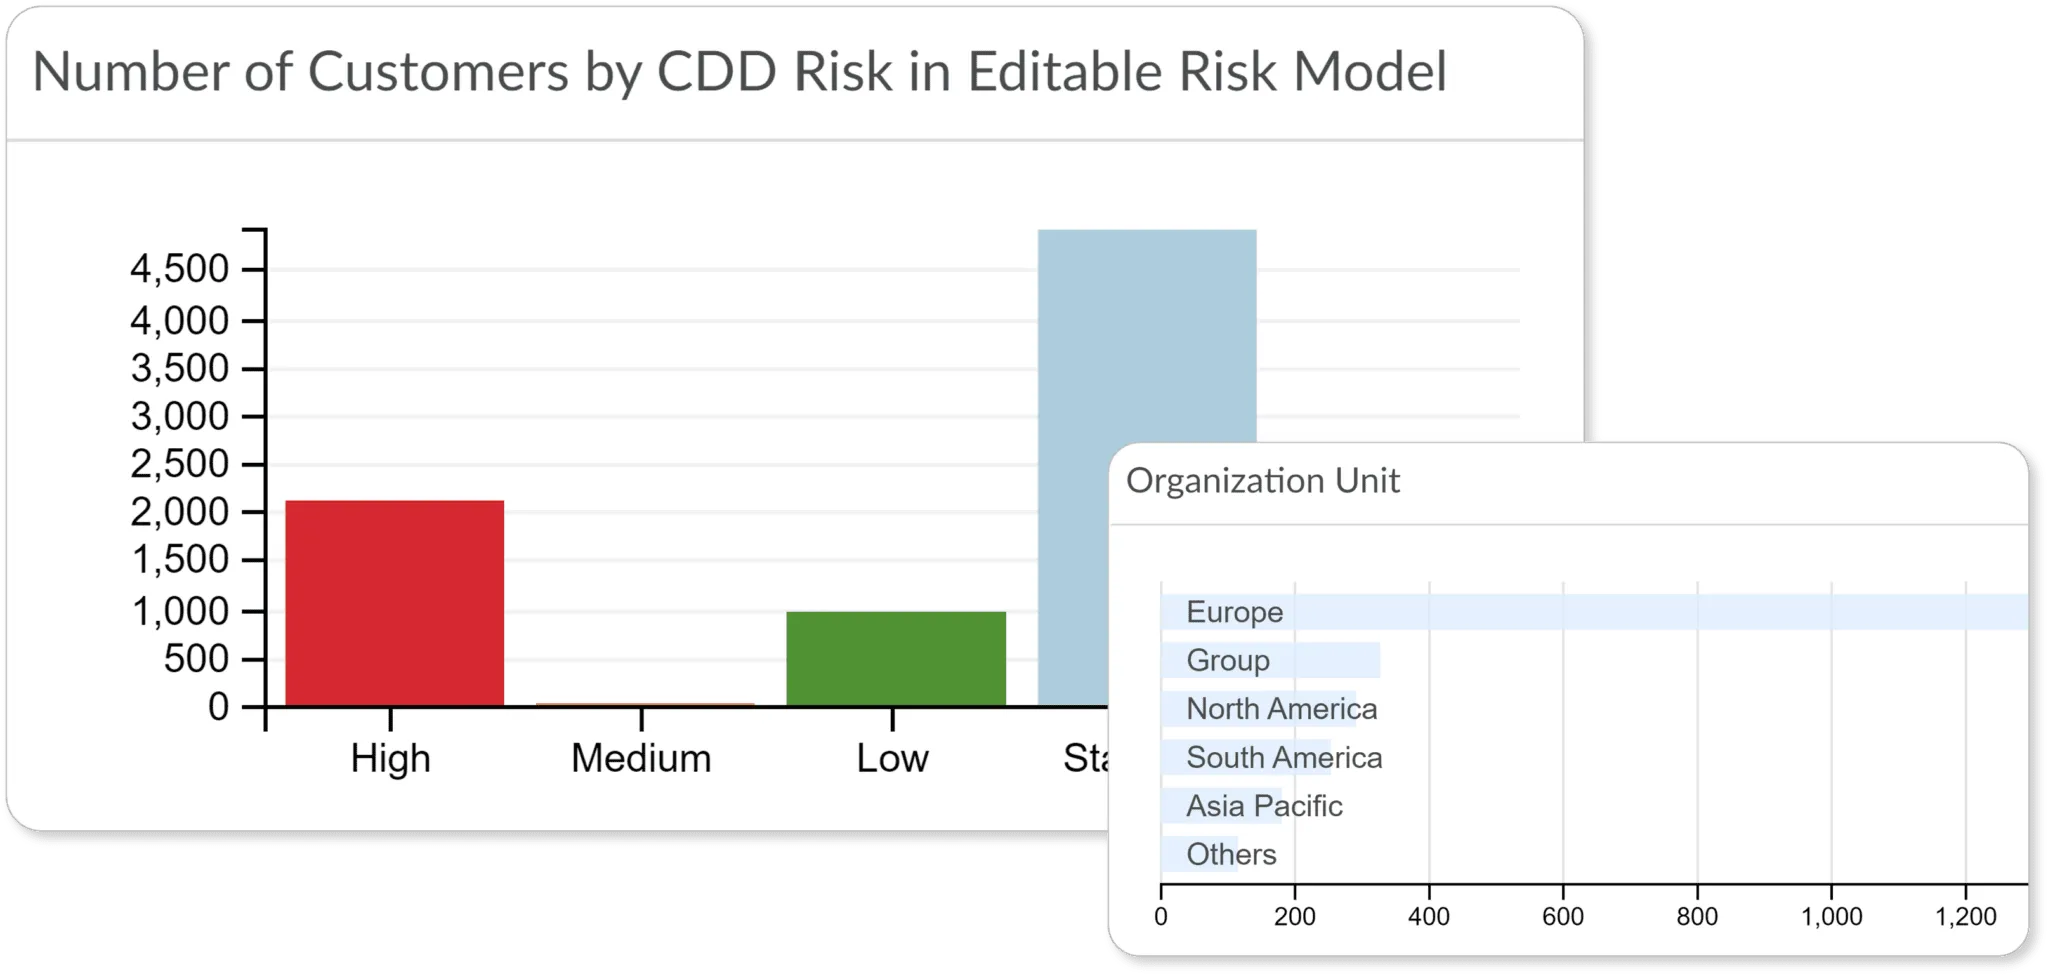
Evidence consistent and defendable decision-making with transparent machine learning models that justify actions taken to regulators and auditors.
Discover more features and functionality of Sanctions Screening

Solution benefits
Accelerate CDD and automate complex tasks to improve the customer experience.
Consolidate all customer data and gain a single, holistic view of a customer’s risk profile.
Ensure adherence to ever-evolving regulatory directives and quickly adapt to changing requirements.
Quickly adjust UBO thresholds to align with regulatory mandates and your risk appetite.
Financial crime prevention for your industry

Elevate your security and compliance while advancing digital transformation with our leading solutions for AML, KYC/CDD, and watch list management.

Reduce costs, safeguard your reputation, and meet regulatory compliance obligations with AI-powered solutions driving innovation and value.

Quickly respond to evolving regulations, competitive challenges, and emerging market prospects with informed, AI-powered decision-making.

Optimize investigator efficiency with solutions designed for high net-worth clients and high-value transaction environments.

.svg)