< Back
Food and Beverage KPI Dashboard
Track the health of every food and beverage plant in one place, from OEE and quality to food safety and profit margin, and focus on the sites that need attention.
Overview
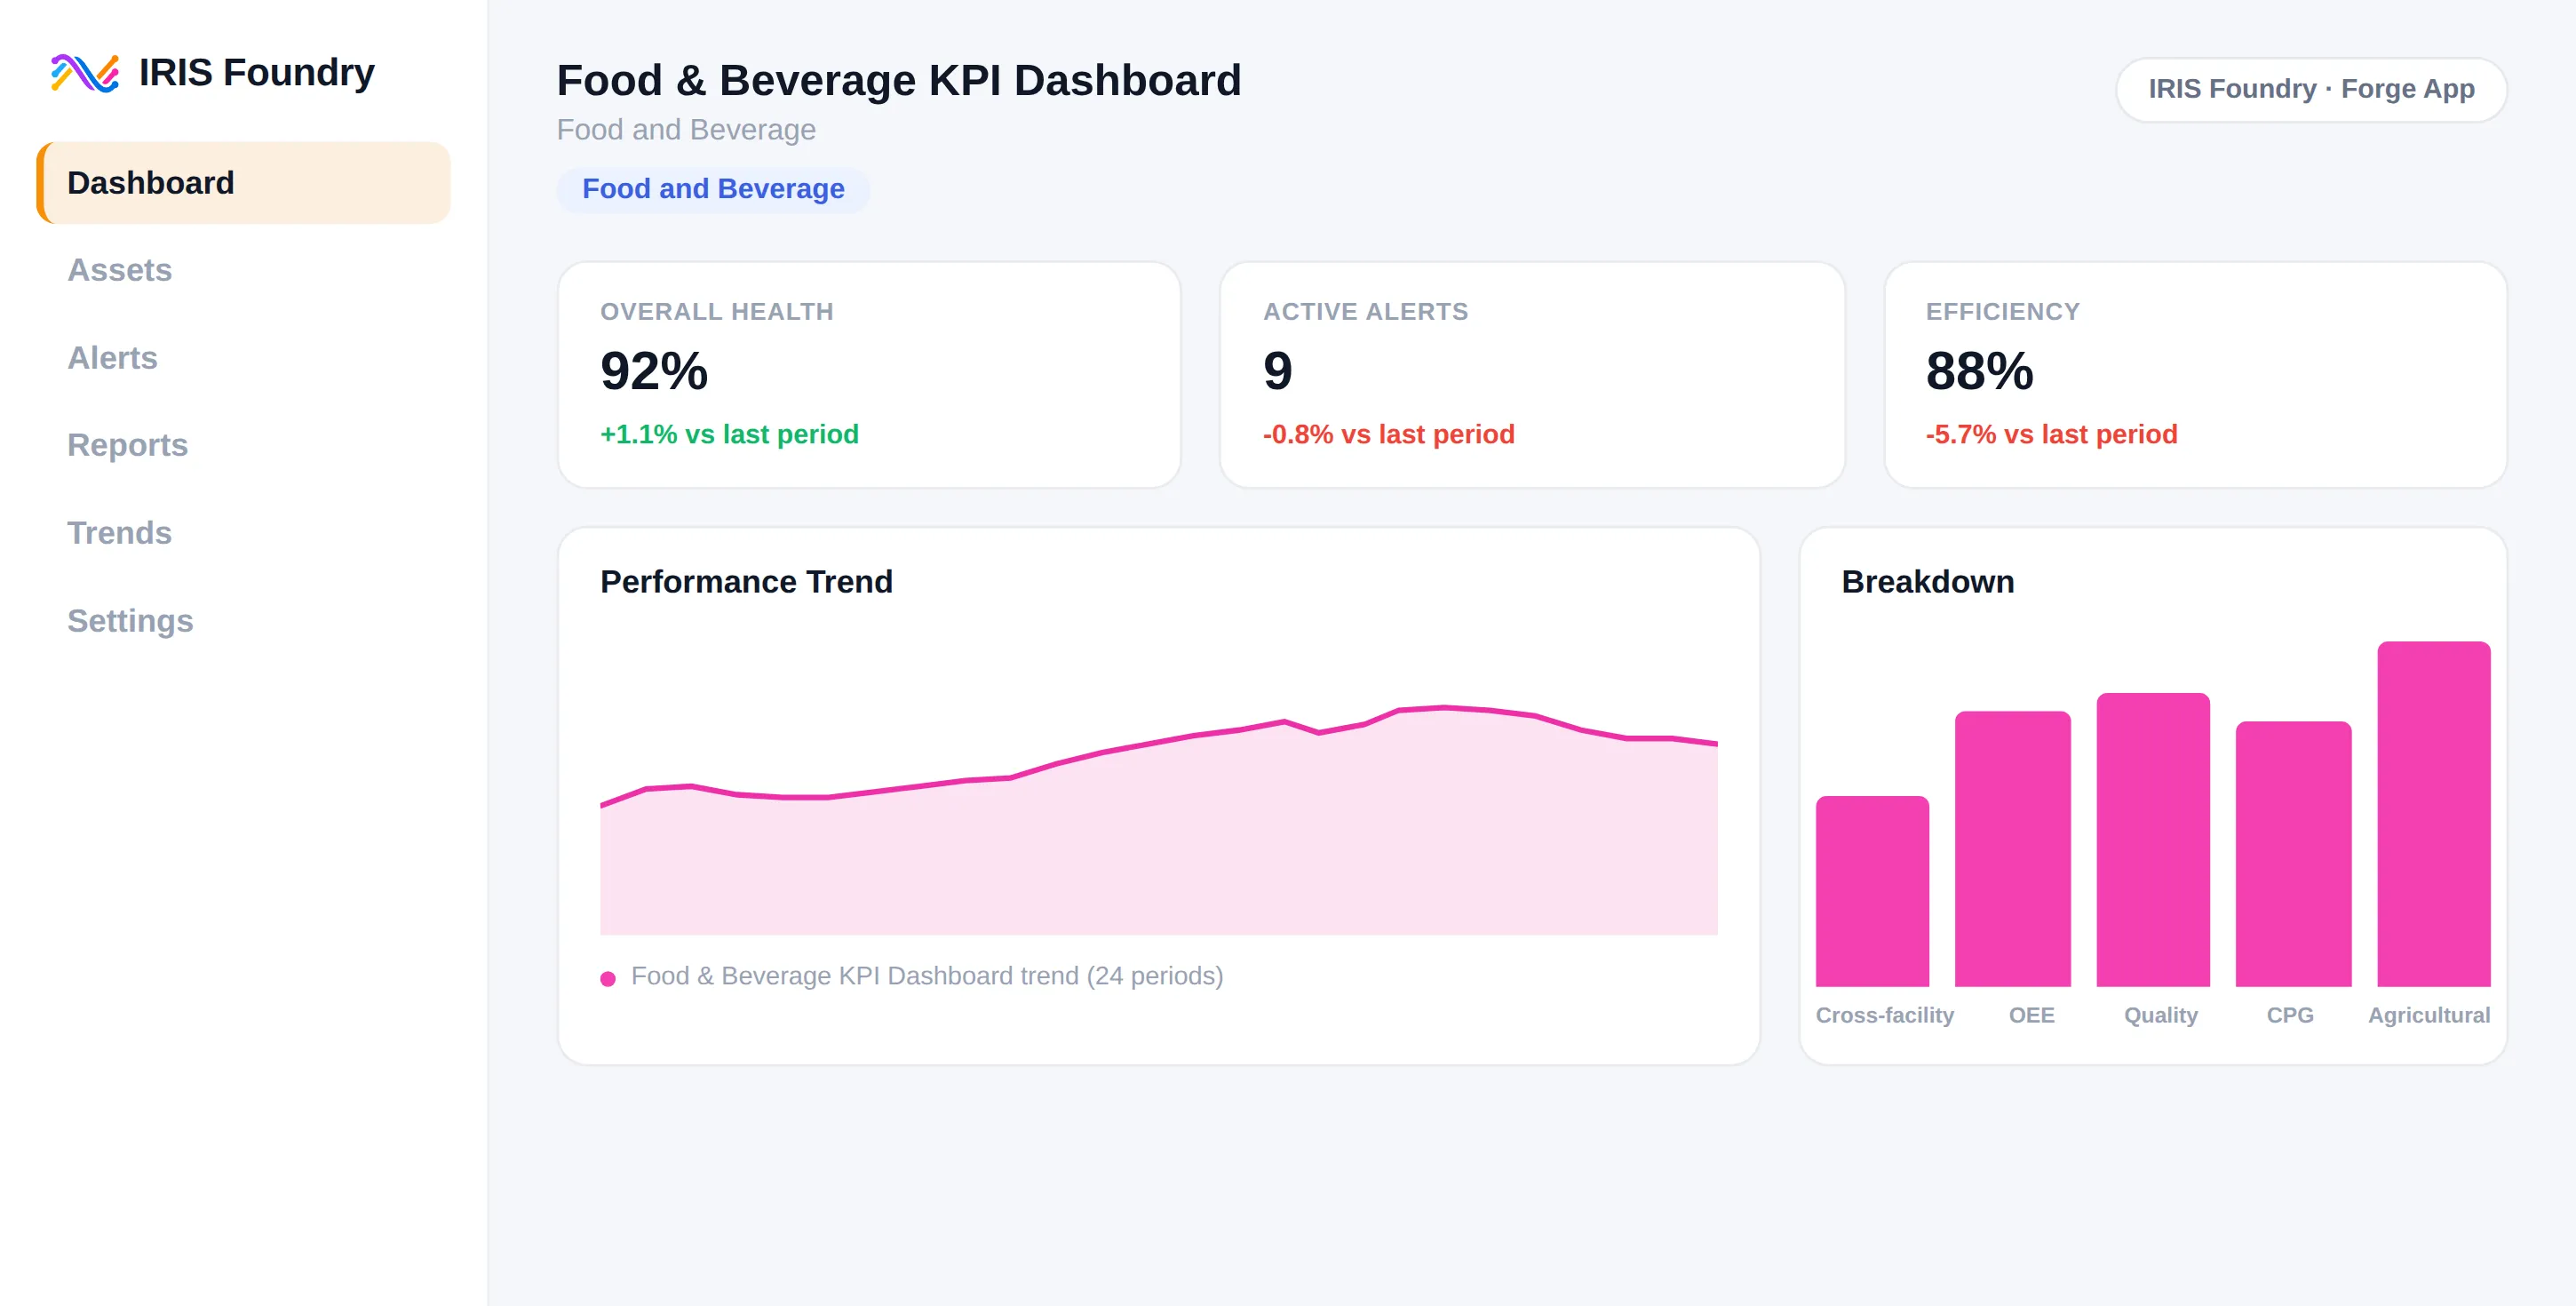
Food and Beverage KPI Dashboard is a single source of truth for operational leaders in food and beverage manufacturing, with real-time visibility into the health of every production facility.
- Cross-facility performance tracking - data from every production site is brought together, so corporate teams compare site efficiency and see which plants are meeting targets and which need intervention.
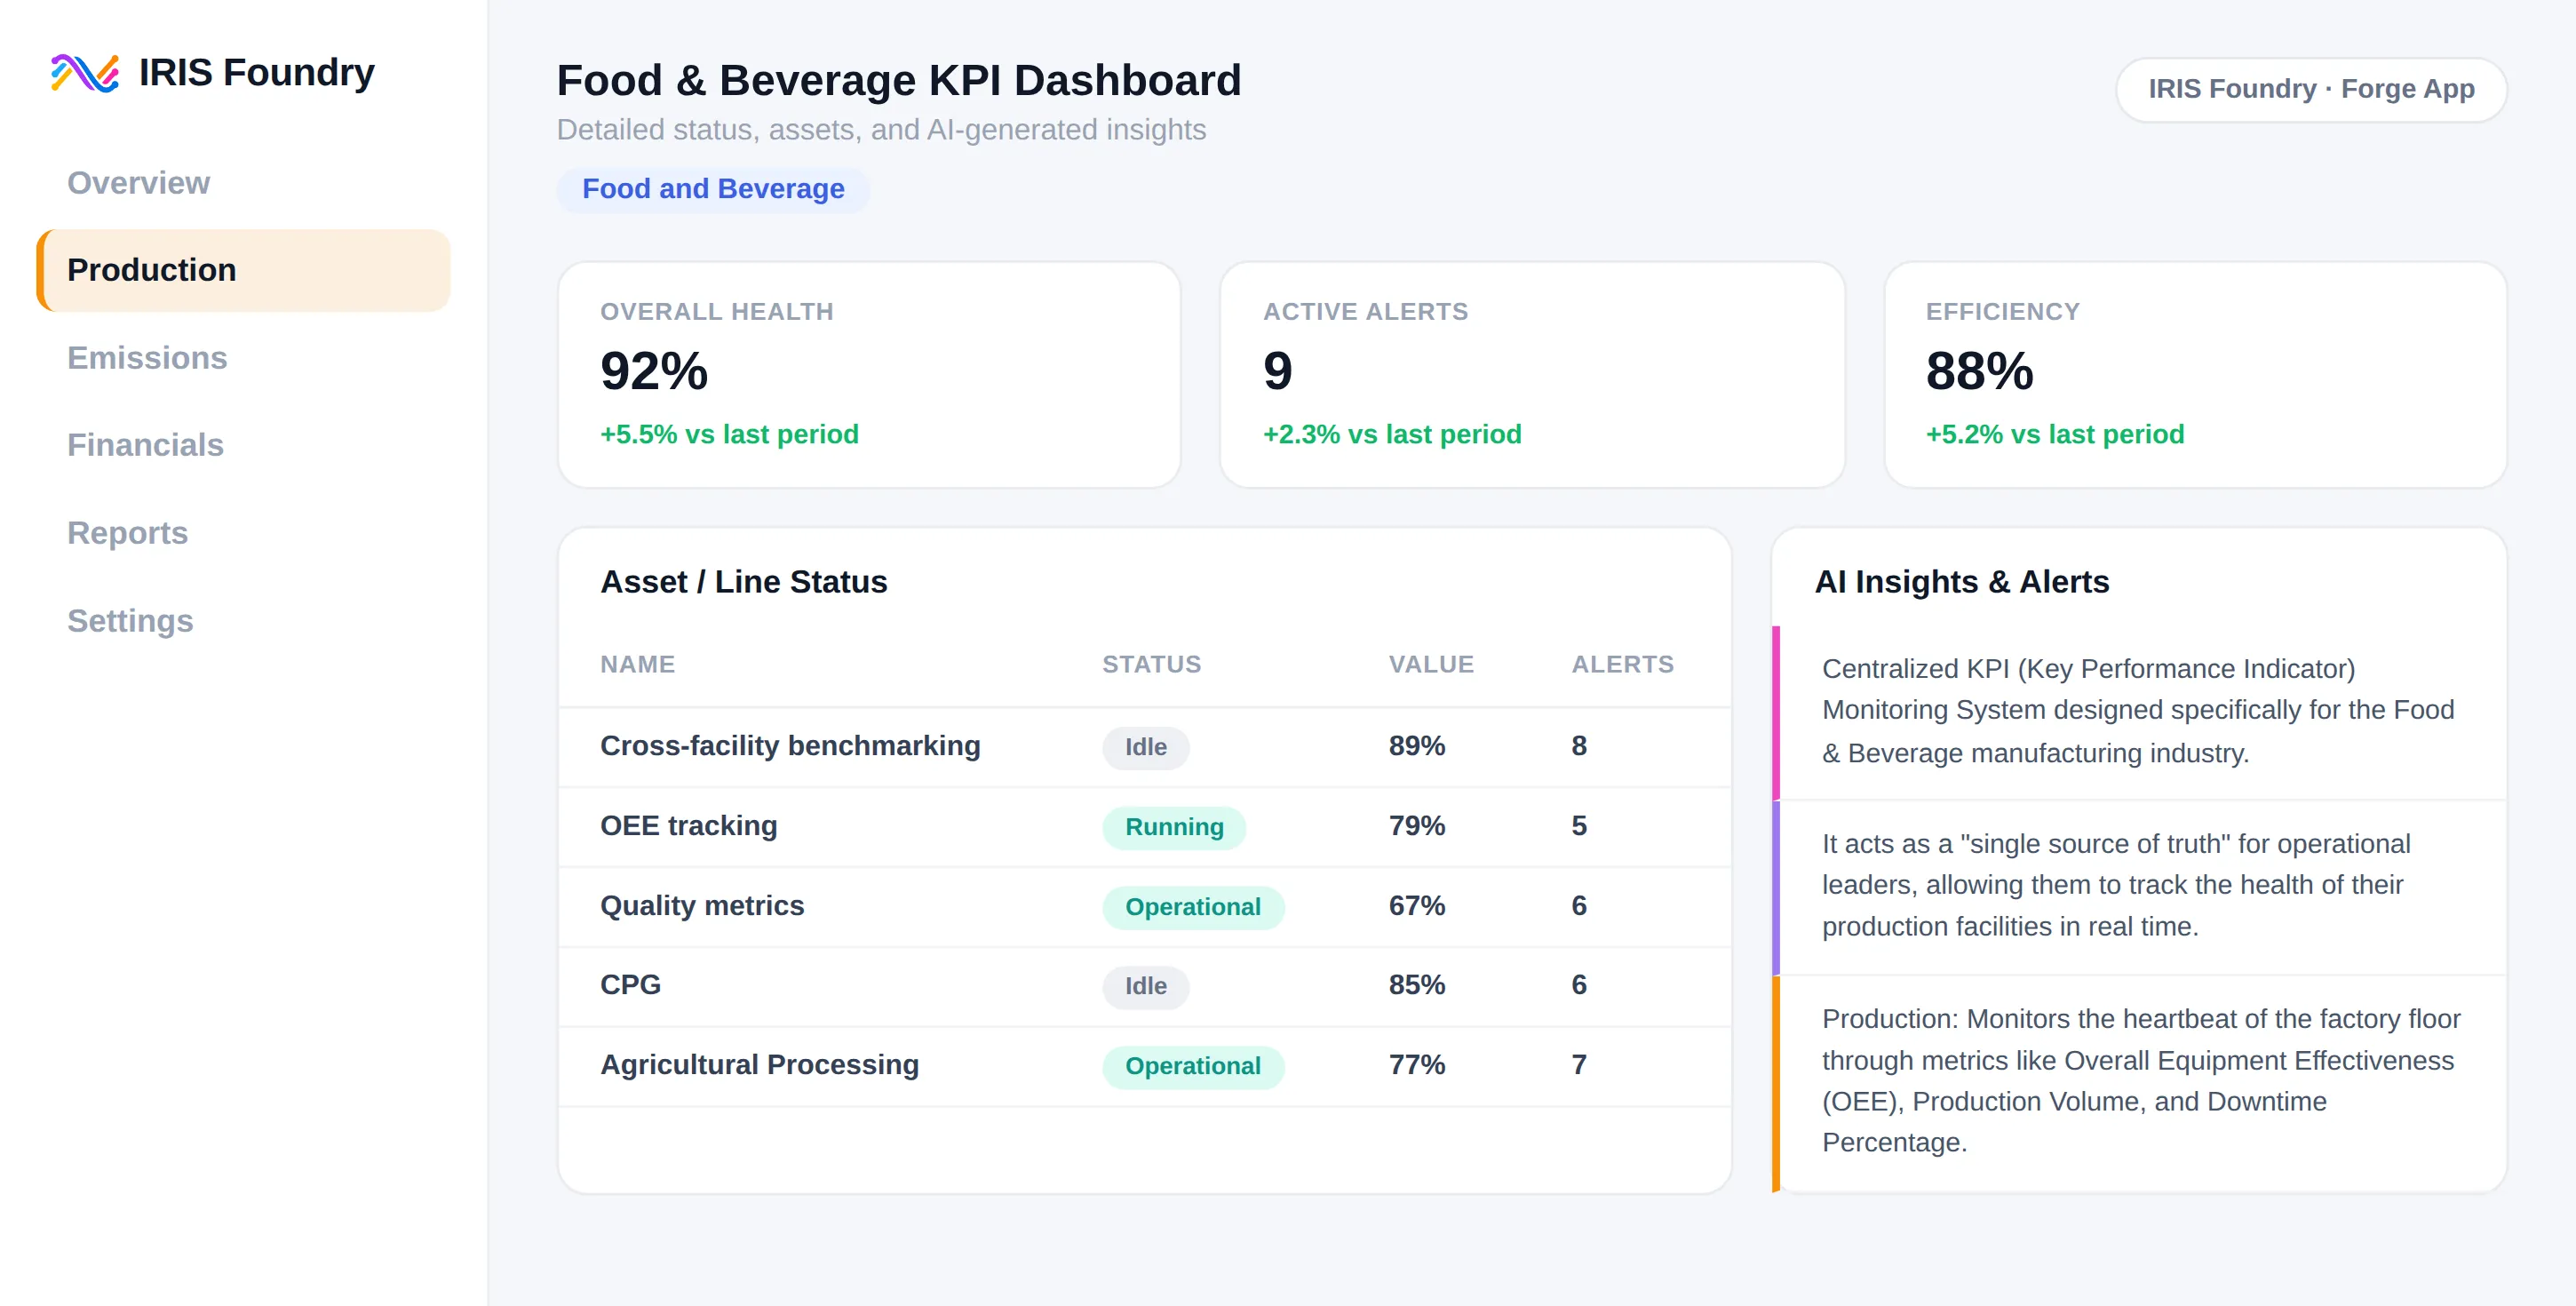
- Production - overall equipment effectiveness (OEE), production volume, and downtime.
- Quality - defect rates, first pass yield, and customer complaint rates to protect brand standards.
- Safety and compliance - food safety audit scores and regulatory compliance rates.
- Operational efficiency - inventory turnover and water and energy efficiency.
- Financial health - cost per unit, labor cost, and profit margin.
- Manage by exception - color-coded statuses, from excellent to critical, compare current values with targets and previous periods, so managers focus only on the areas trending down or missing benchmarks.
- Connect the floor to the bottom line - financial metrics such as return on assets sit alongside technical data such as batch cycle time, showing executives how improvements on the factory floor translate into financial gains.

No items found.
