IRIS Workspace transforms industrial analysis and collaboration
Simultaneously collaborate with AI-powered analysis and live industrial information in an infinitely sized environment.
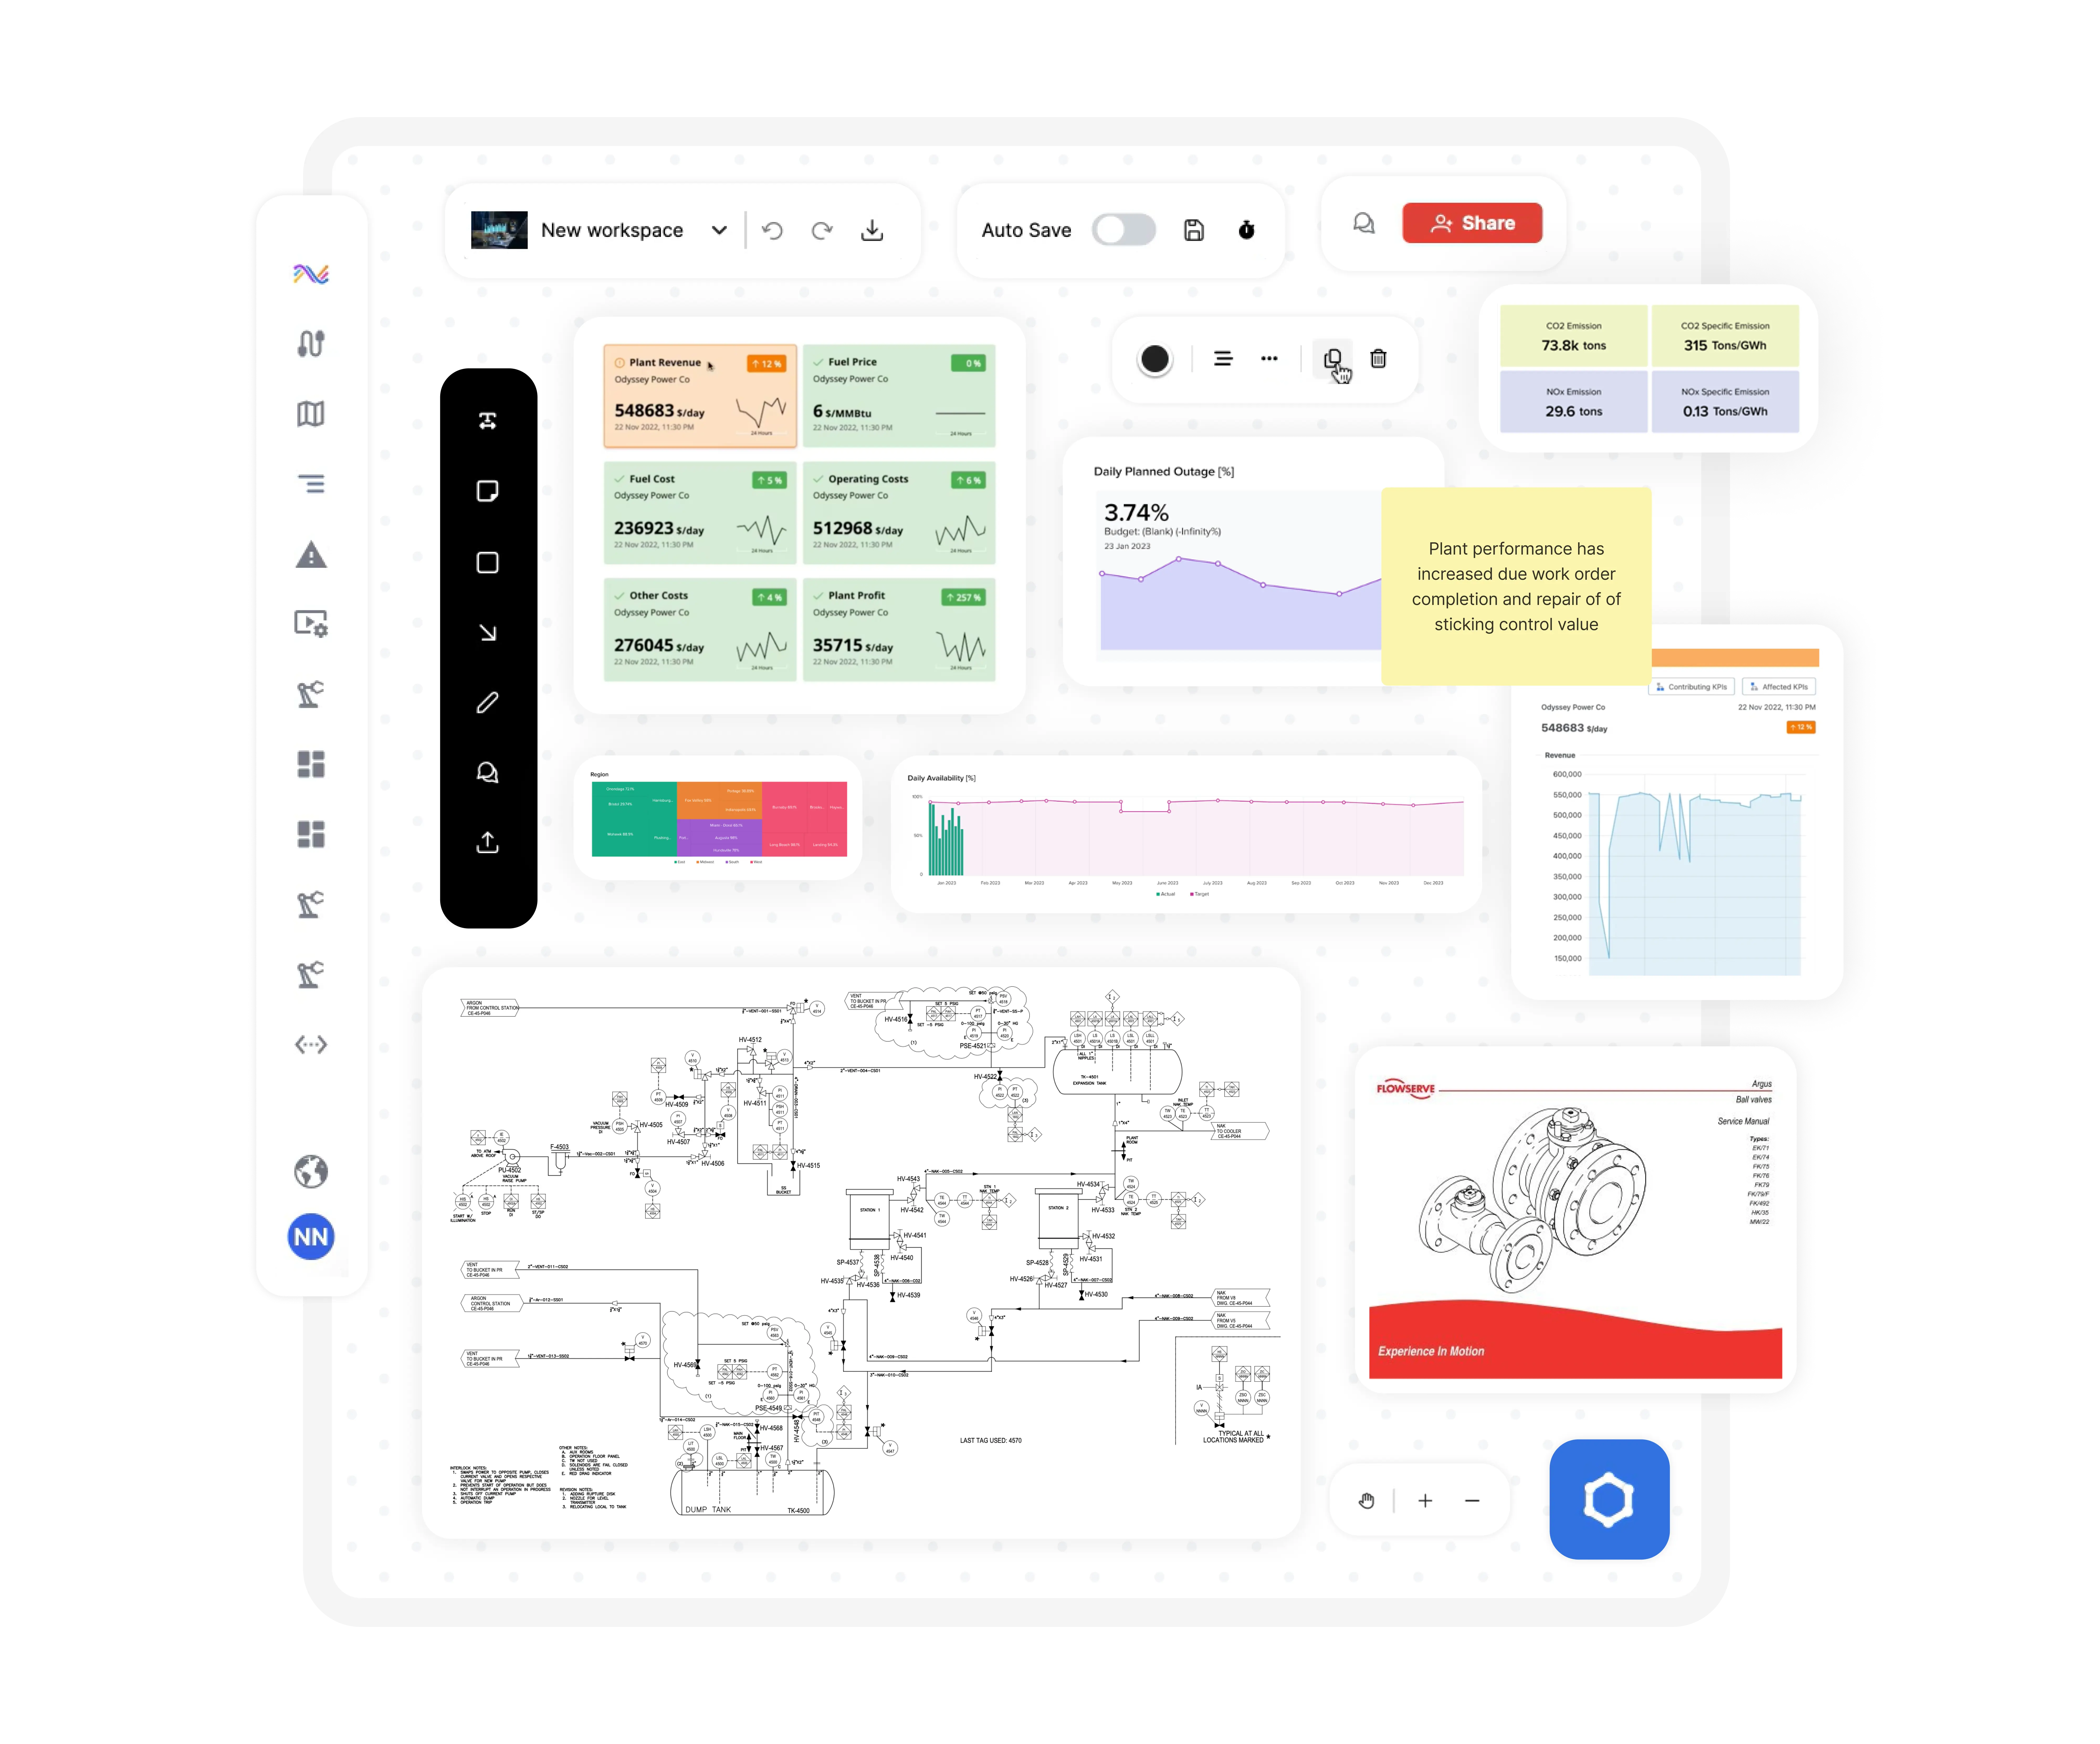

Learn how analyzing live industrial data in a collaborative environment can reduce time spent gathering data, increase knowledge sharing, and deliver data-driven analysis.
Collaborate for fast analysis and minimize data gathering
hours per week spent searching and gathering information
increase in productivity through collaboration
reduction in the time to access relevant information
Simultaneous collaboration and analysis
Rapidly remediate and prevent operational disruptions across people, processes, and assets
.gif)
Today, analysis is manual and error-prone, as users struggle to access siloed data sources, each available to a limited number of people. IRIS Workspace is a live, collaboration environment that reduces the time-consuming, manual efforts to find information required to analyze process and production deviations, determine the corrective action, and prevent future deviations by building knowledge into the daily workflows of plant managers, data scientists, executives and other industrial knowledge workers.
Empower cross-functional teams to simultaneously engage with time-series, P&IDs (piping and instrument diagrams), documents, drawings, and images in a shared workspace for real-time problem solving using unified and contextualized data from IRIS Foundry, an AI powered, composable industrial dataops platform.
Industrial knowledge workers can add notes and comments, notify other users, draw freehand, and annotate in the workspace with the built-in toolbar. With version tracking, data and user audit, and various other capabilities for governance, analysis can be verified and trusted.
IRIS Workspace seamlessly integrates with IRIS copilot, introducing powerful generative and predictive AI into the collaboration workspace to provide search, summarization, insights, pattern recognition, and recommendations.
Simplify how industrial users engage and generate insights with industrial data
IRIS Workspace, built into IRIS Foundry, seamlessly delivers contextualized industrial information to all users.
Eliminate offline, siloed spreadsheet analysis that requires manual updates to analyze processes, production, and equipment. With IRIS Workspace, simultaneously collaborate in a unified environment to further investigate and validate operational changes.
With this connected and live environment, industrial knowledge workers can engage with time series, P&IDs (piping and instrument diagrams), documents, drawings, and images in a shared workspace for real-time problem-solving using unified and contextualized data from IRIS Foundry.

All industrial knowledge workers can interact within a shared workspace at the same time. Adding notes and comments, notifying users, drawing freehand, or using the built-in annotation toolbar to quickly add context and subject matter expertise to any analysis.
Plant managers can use IRIS Workspace to create highly interactive and live ‘shift-change dashboards’ to share with operators for continuous iterations on risk and resource management. Process analysts can create deviation reports and digitally tag the data sources, assets, and preventive actions for historical and genealogy purposes.
.gif)
No upskilling is required to adopt. Populate the workspace with industrial information in an infinitely scalable workspace from purpose-built applications, the industrial knowledge graph, or local files to analyze all information in a single environment.
Use the annotation tool bar to add shapes and industrial symbols, draw freehand to mark-up drawings, and tag and notify users to increase the collaboration. All analysis can be done using the intuitive user interface. No coding is required and components are drag and drop.
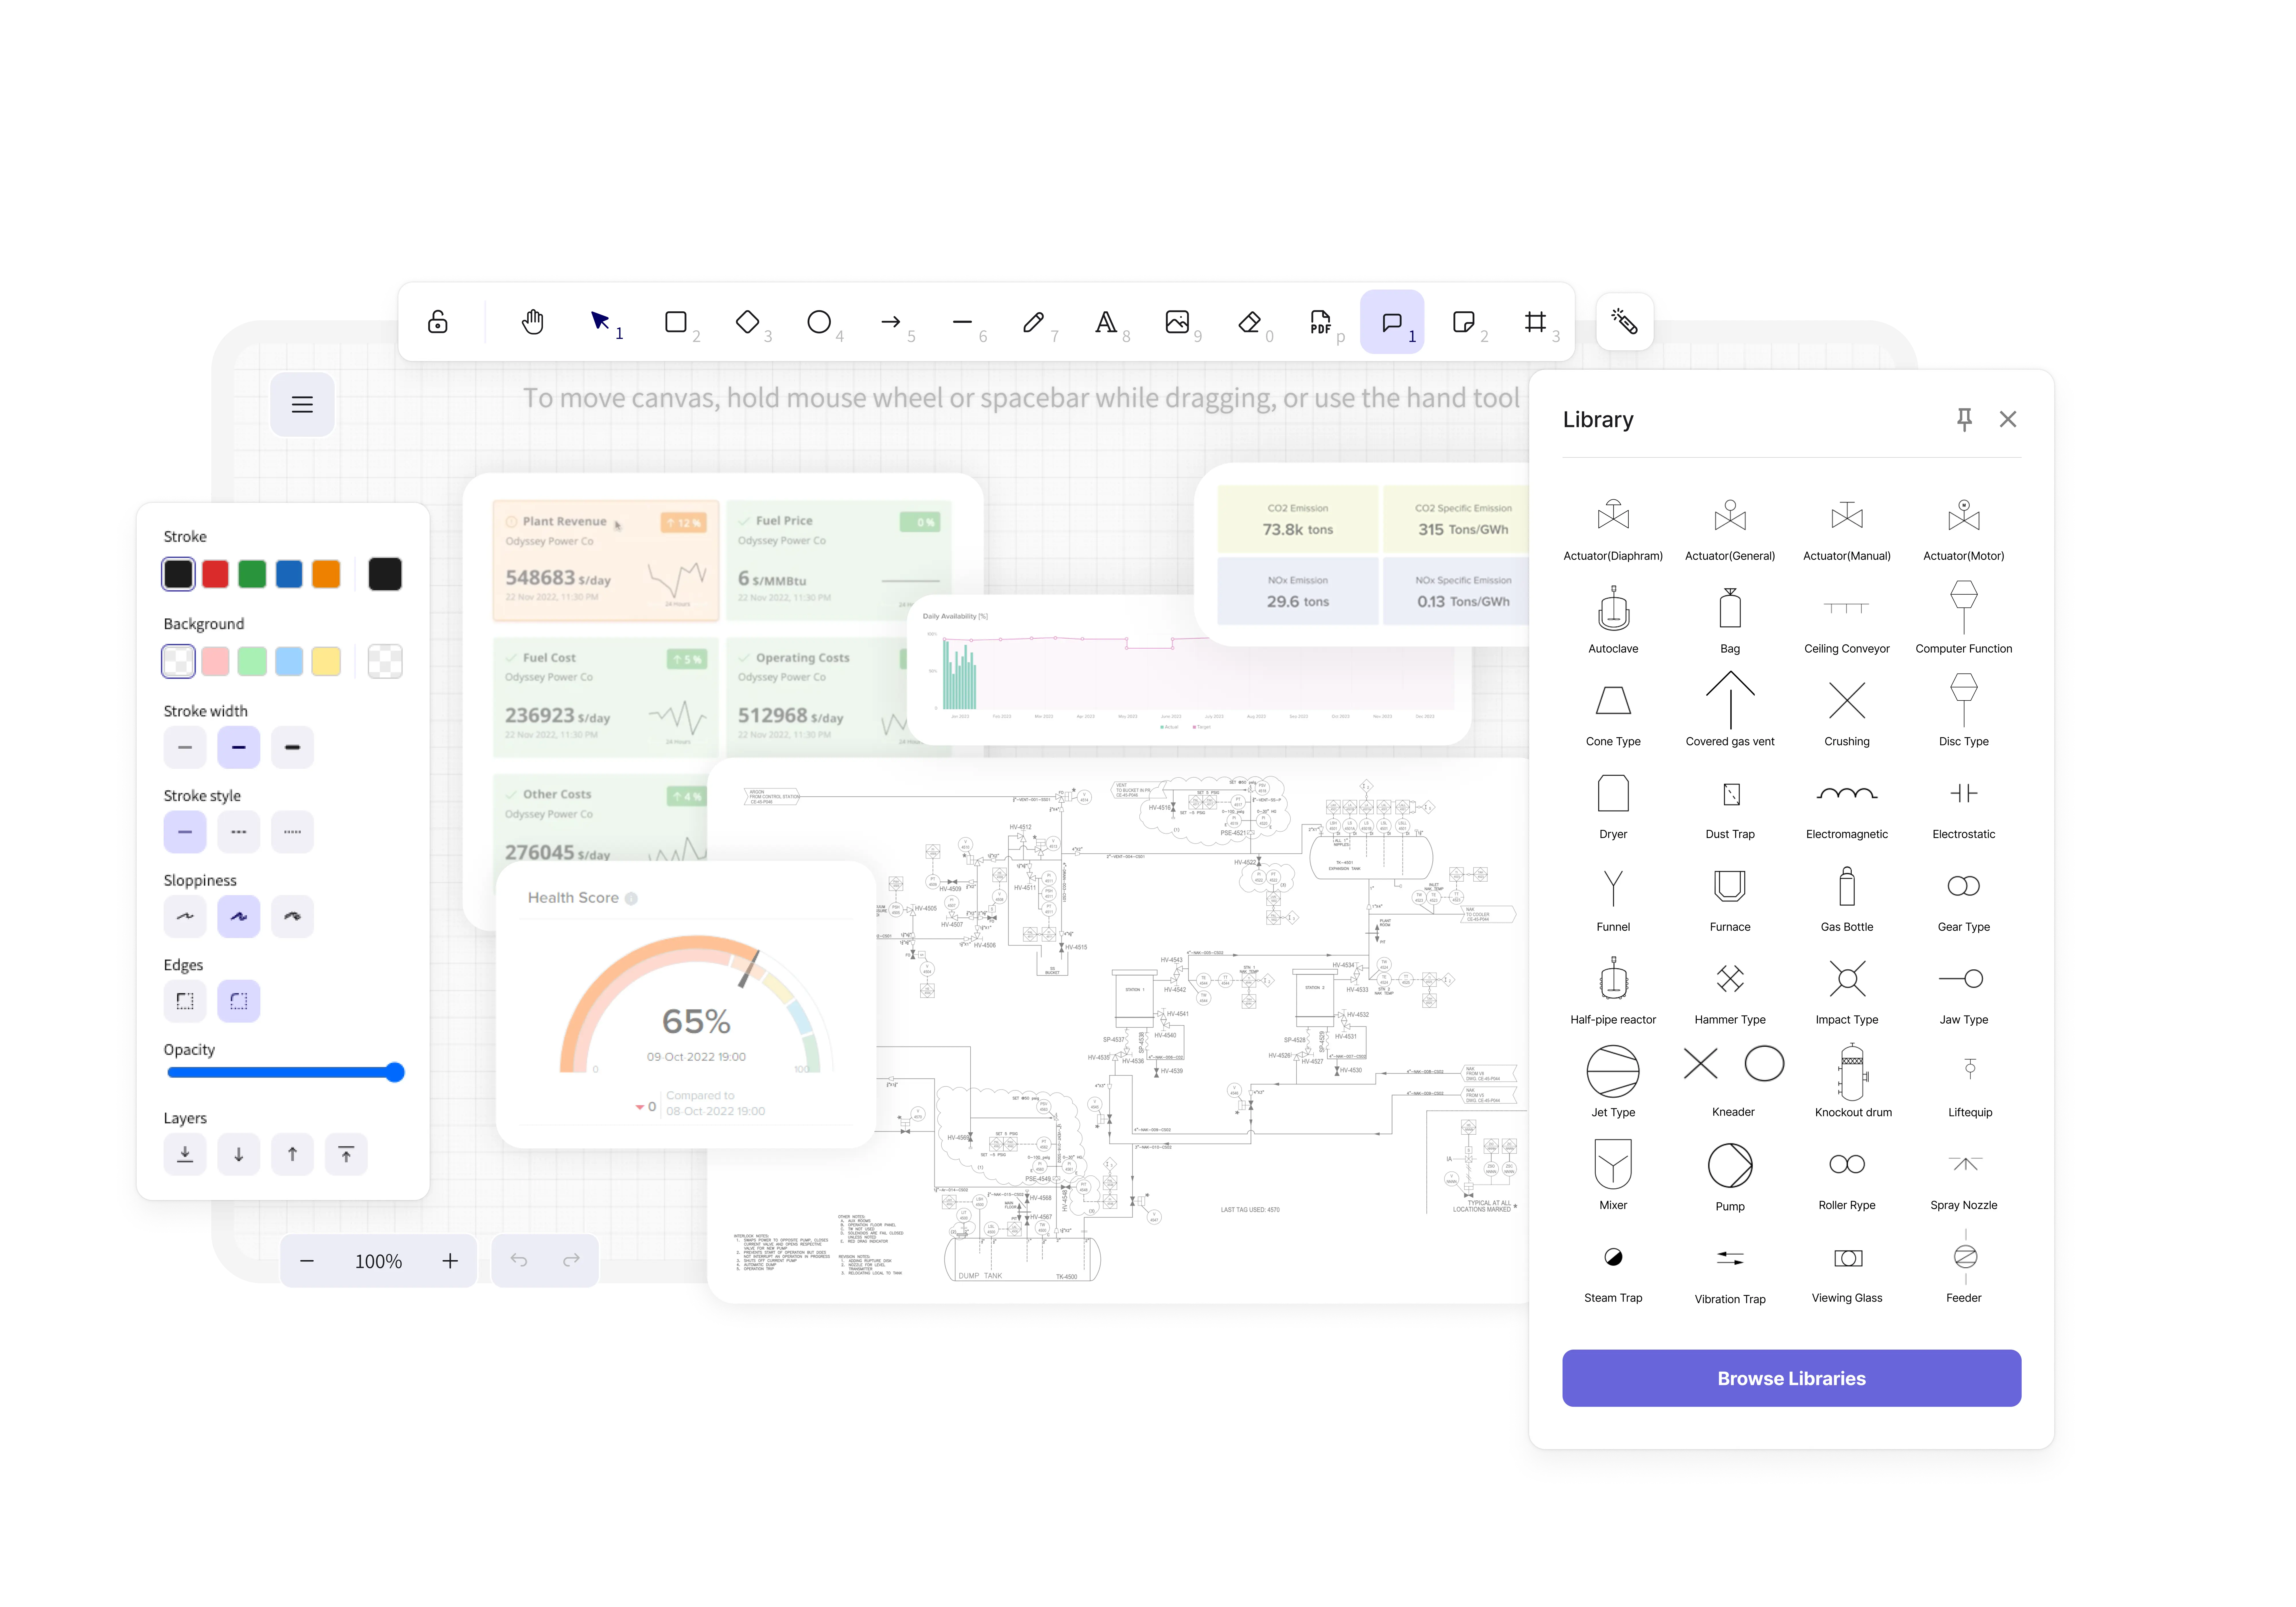
Increase the impact of AI for industrial workers. Seamless integration with IRIS copilot introduces a powerful generative and predictive AI entity into the collaborative workspace providing search, summarization, insights, pattern recognition and recommendations.
Search and create summaries of documents such as operator inspections, oil and vibration analysis, and production reports. Search or generate new images for analysis. With IRIS Copilot built-in, teams can accelerate their analysis with predictive and generative AI.
.gif)
Track the evolution of each workspace using the navigation bar and follow changes to the workspace over time. Verify new information and view who has made changes. Access controls provide the governance to manage teams and users. For example, a production manager can post live changes to the production schedule and all frontline teams can plan their day knowing they are viewing the current production schedule.
Validate the quality of data sets and individual data points from the IRIS Foundry industrial DataOps platform to ensure that analysis can be trusted.
.gif)
