Industrial AI Solutions

Unlock smarter operations with SymphonyAI’s curated library of industrial AI applications and agents for industrial monitoring, predictive asset intelligence, process optimization, and more.​

Three rectangular platforms in metallic gold finish arranged at different heights against a black background.
Category
Industry
Thank you! Your submission has been received!
Oops! Something went wrong while submitting the form.
Request a demo
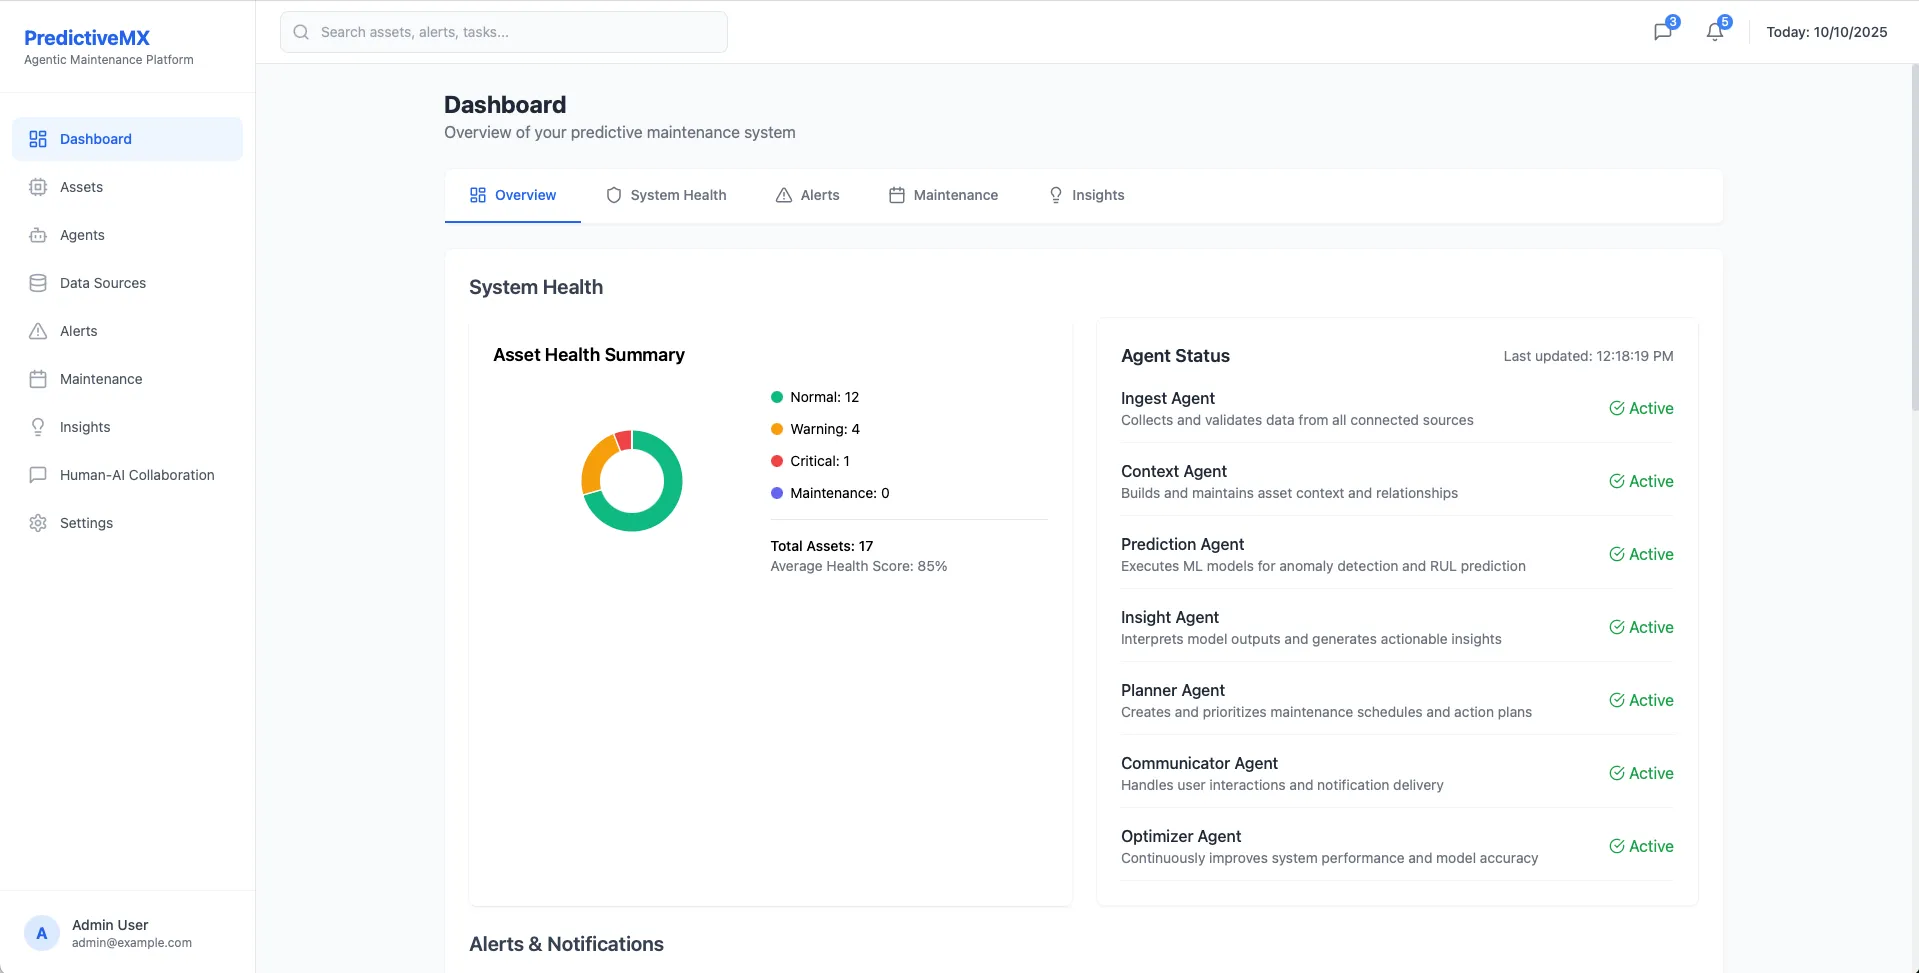
Agentic Predictive Maintenance (PredictiveMX)
Discrete Manufacturing
Utilities
Metals and Mining
Oil and Gas
CPG
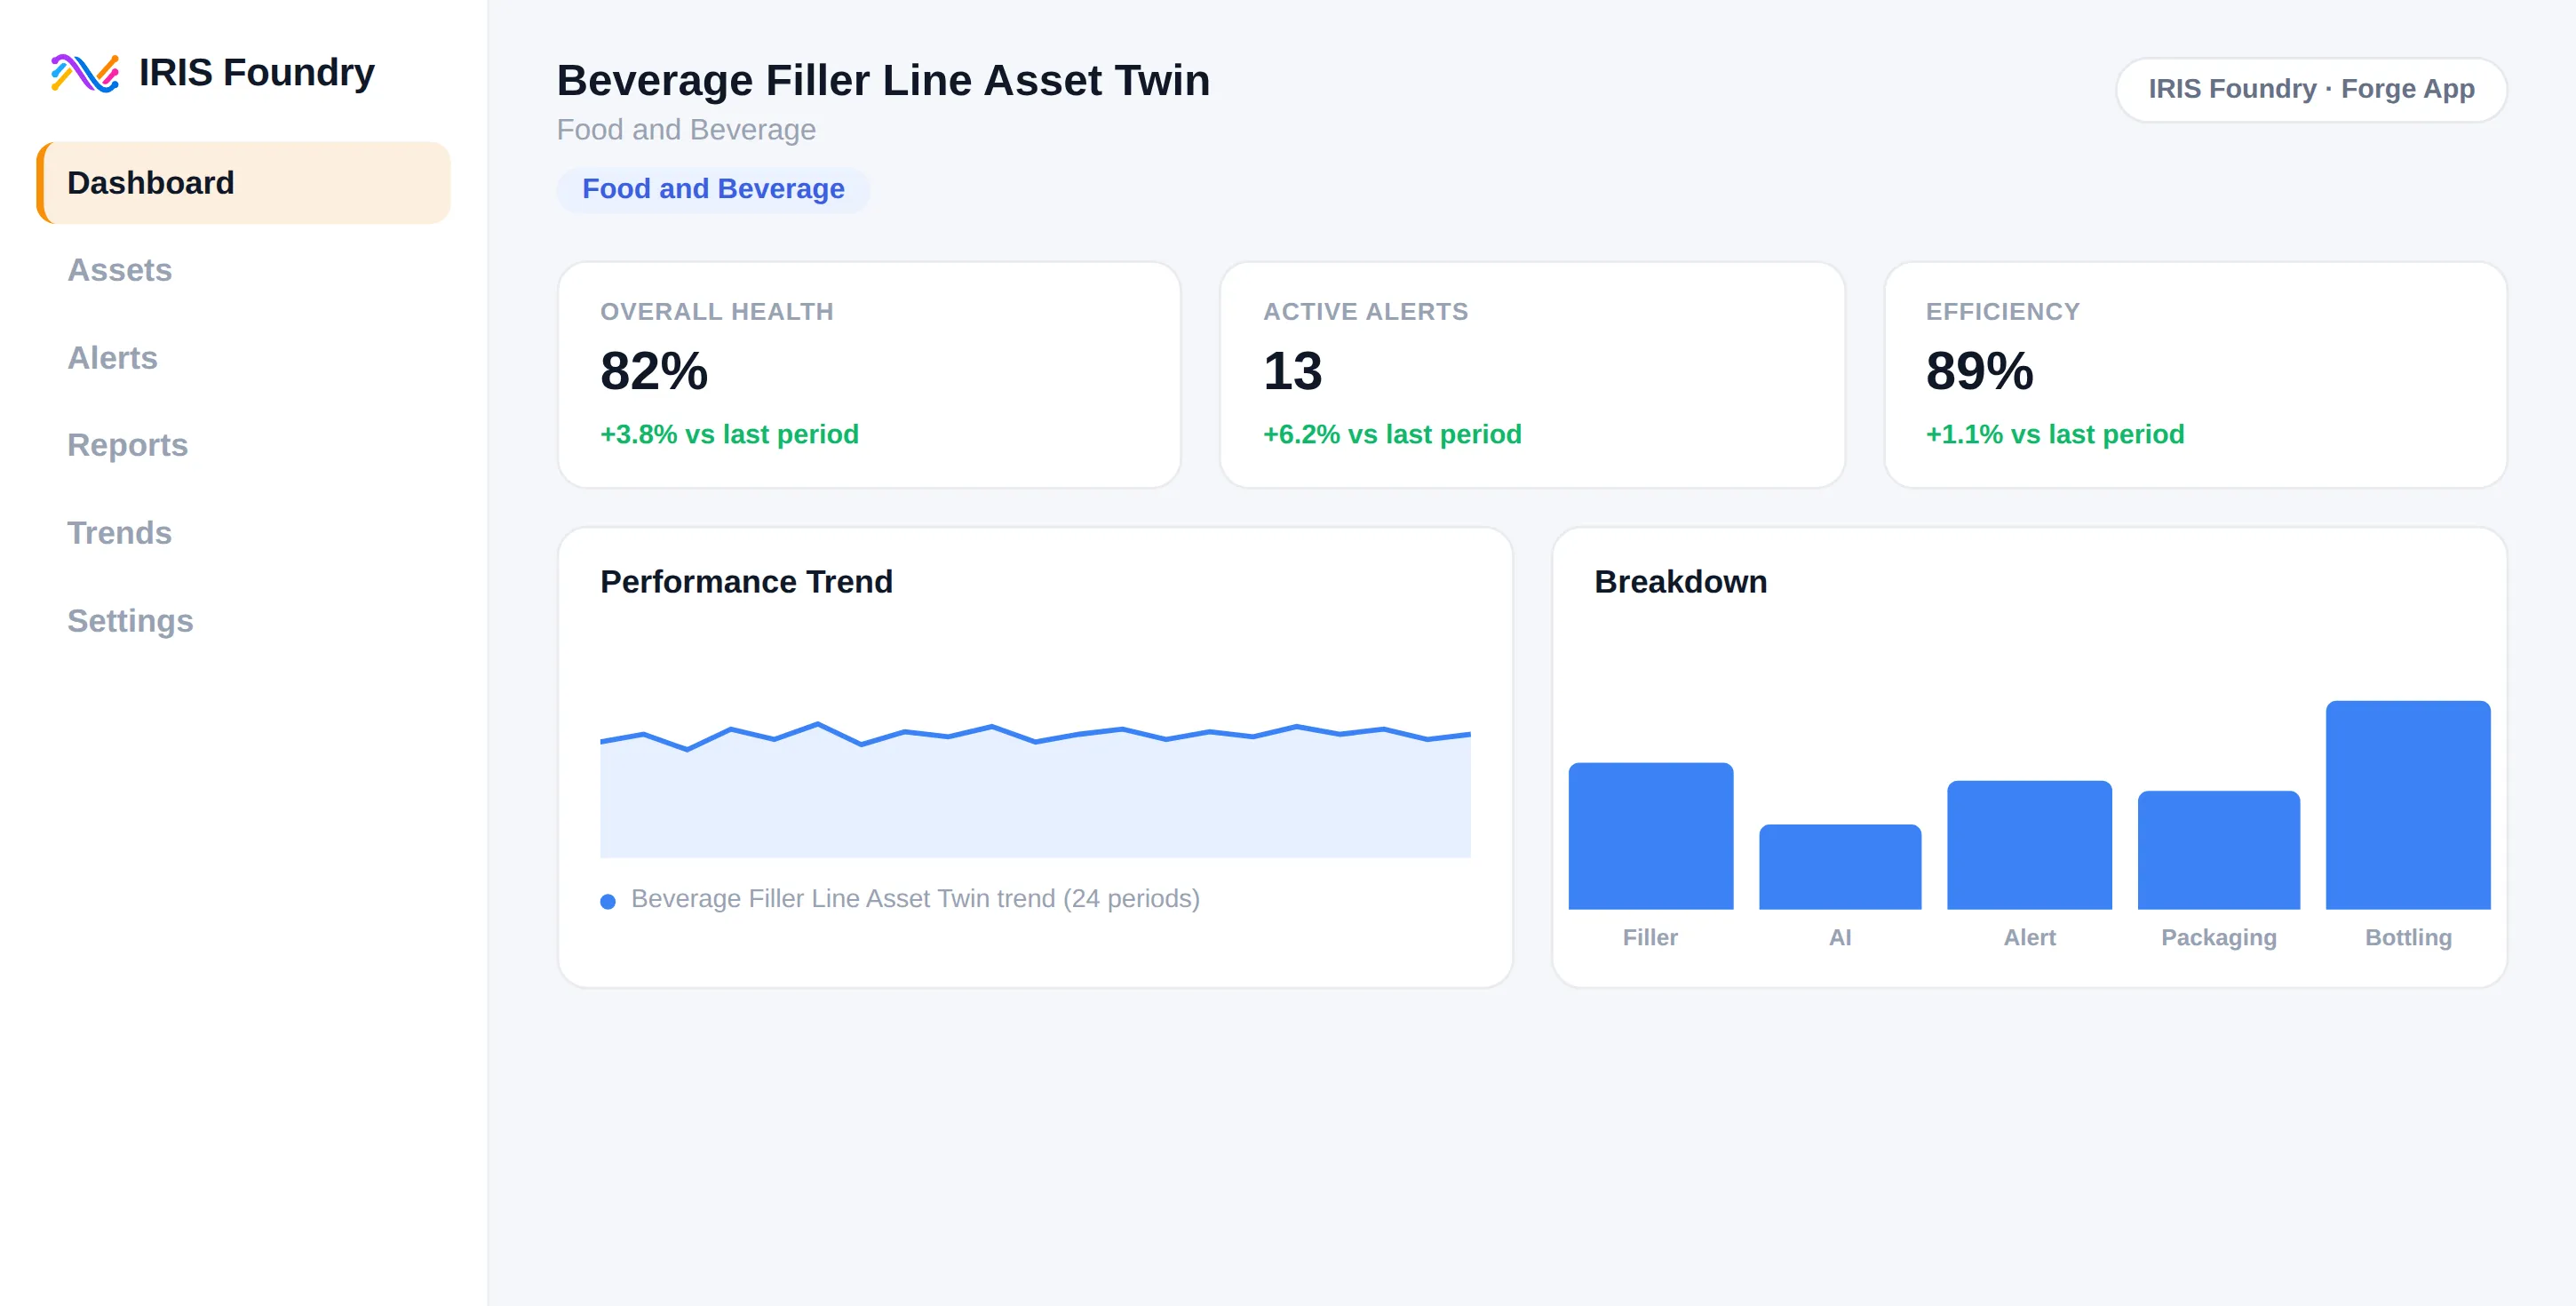
Beverage Filler Line Asset Twin
Food and Beverage
CPG
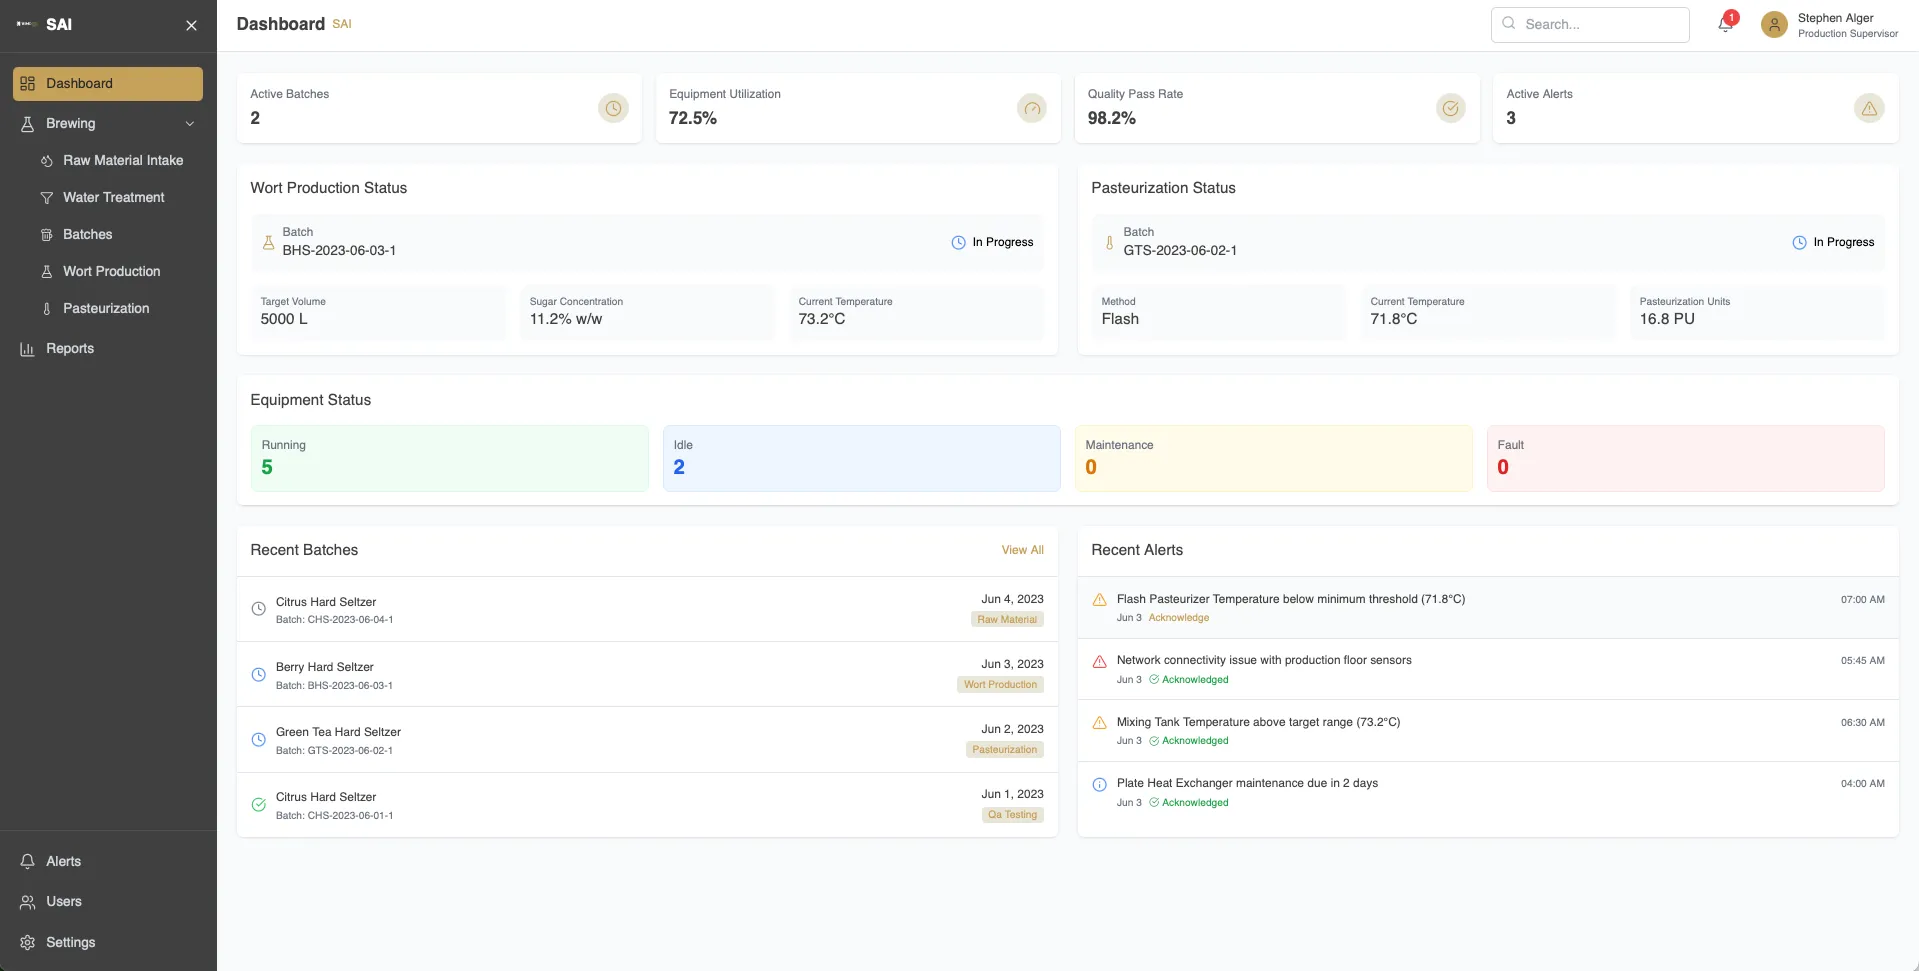
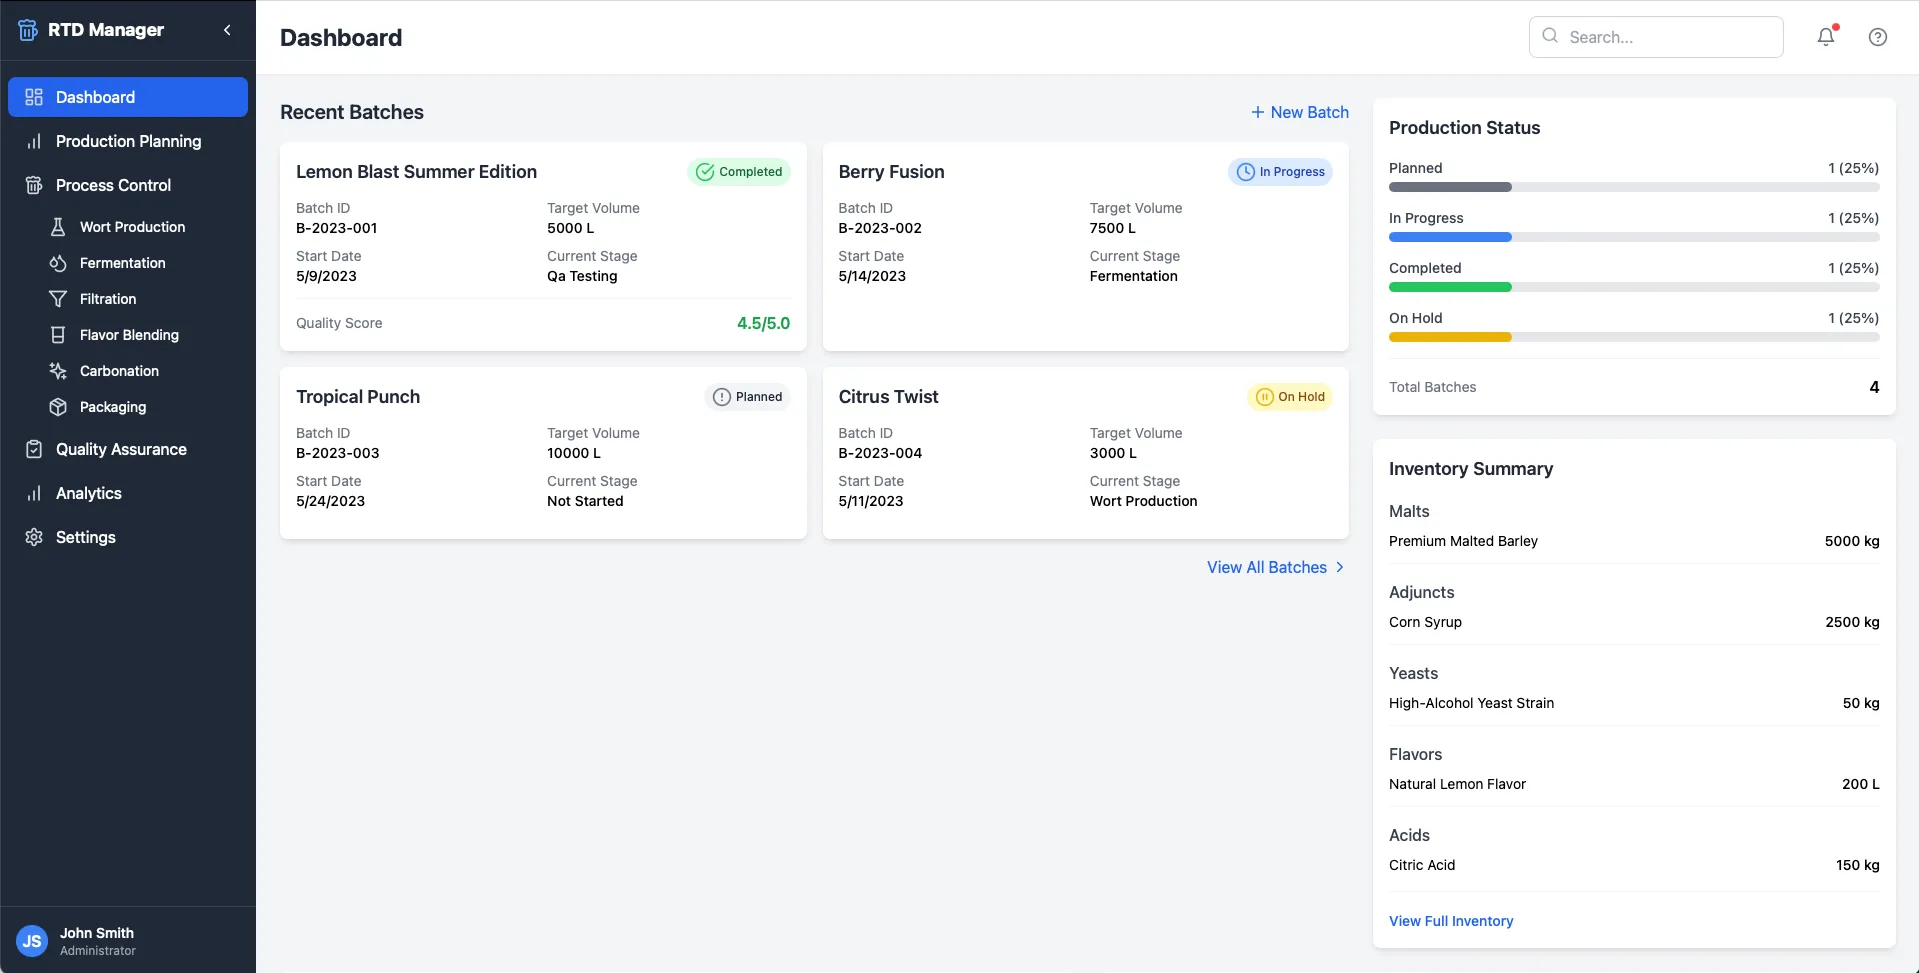
Brewing Wort Ops
Food and Beverage
CPG
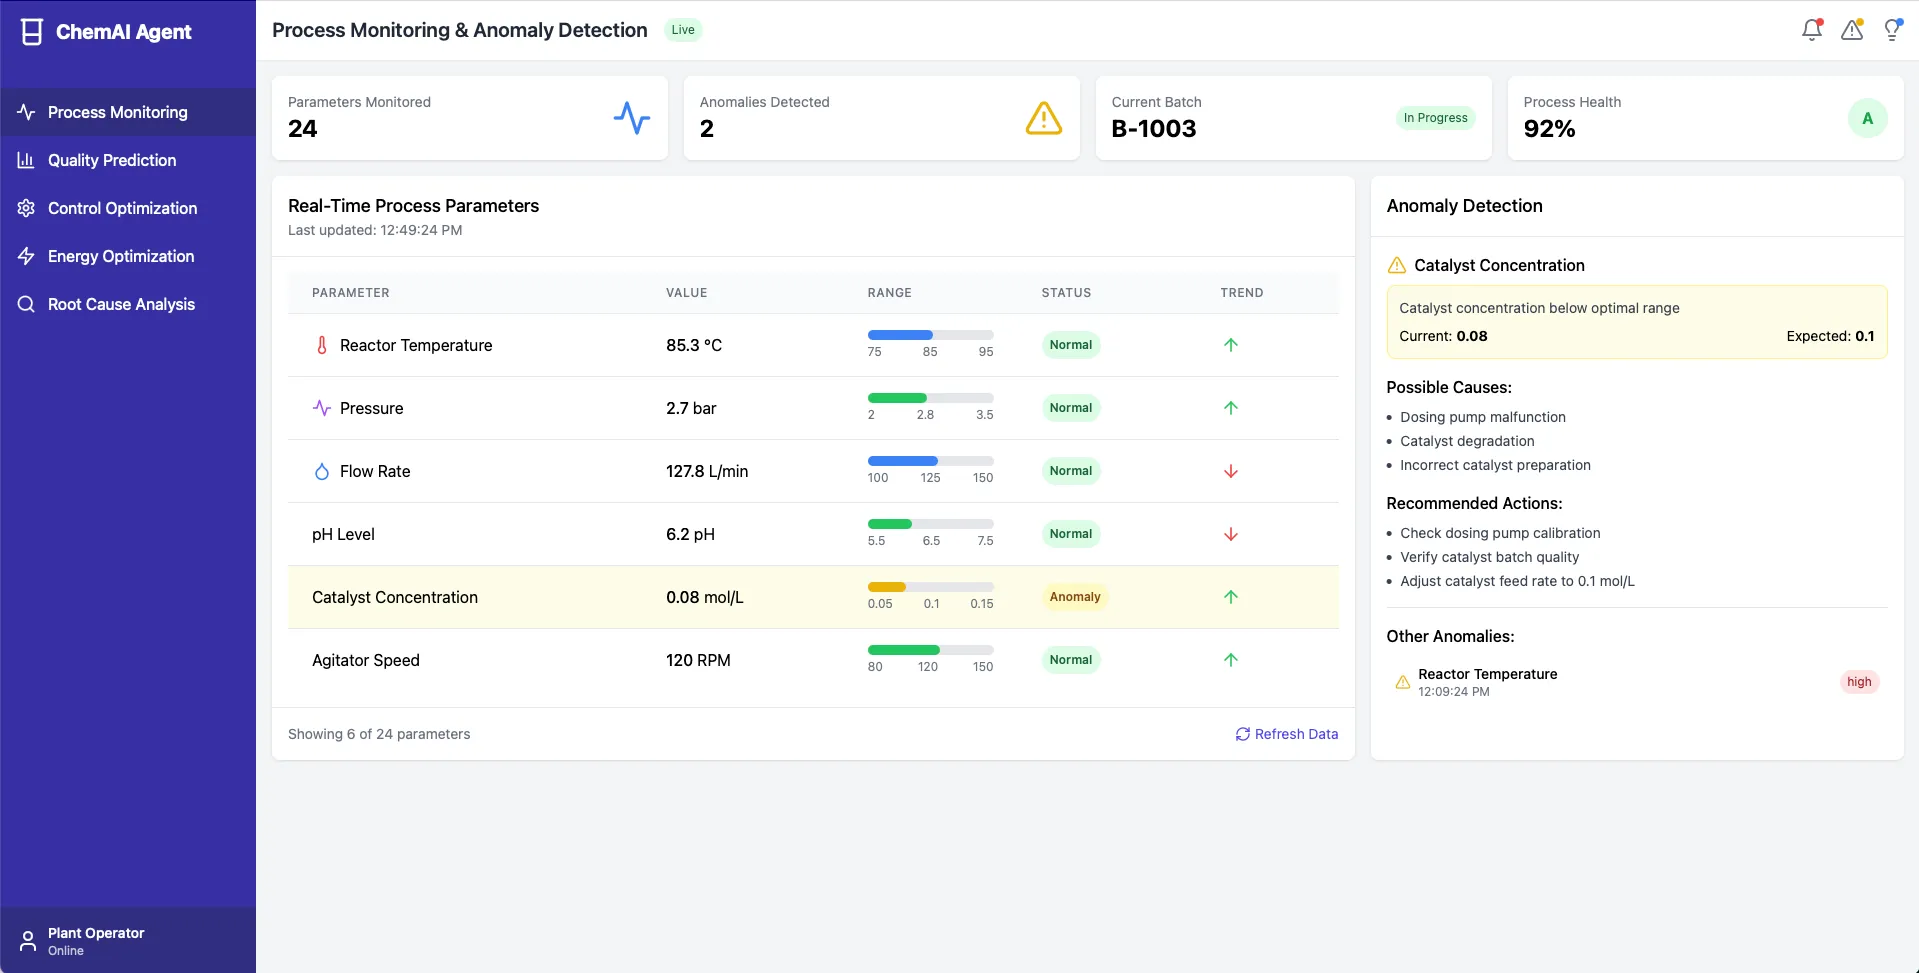
Chemical Optimization
Chemical
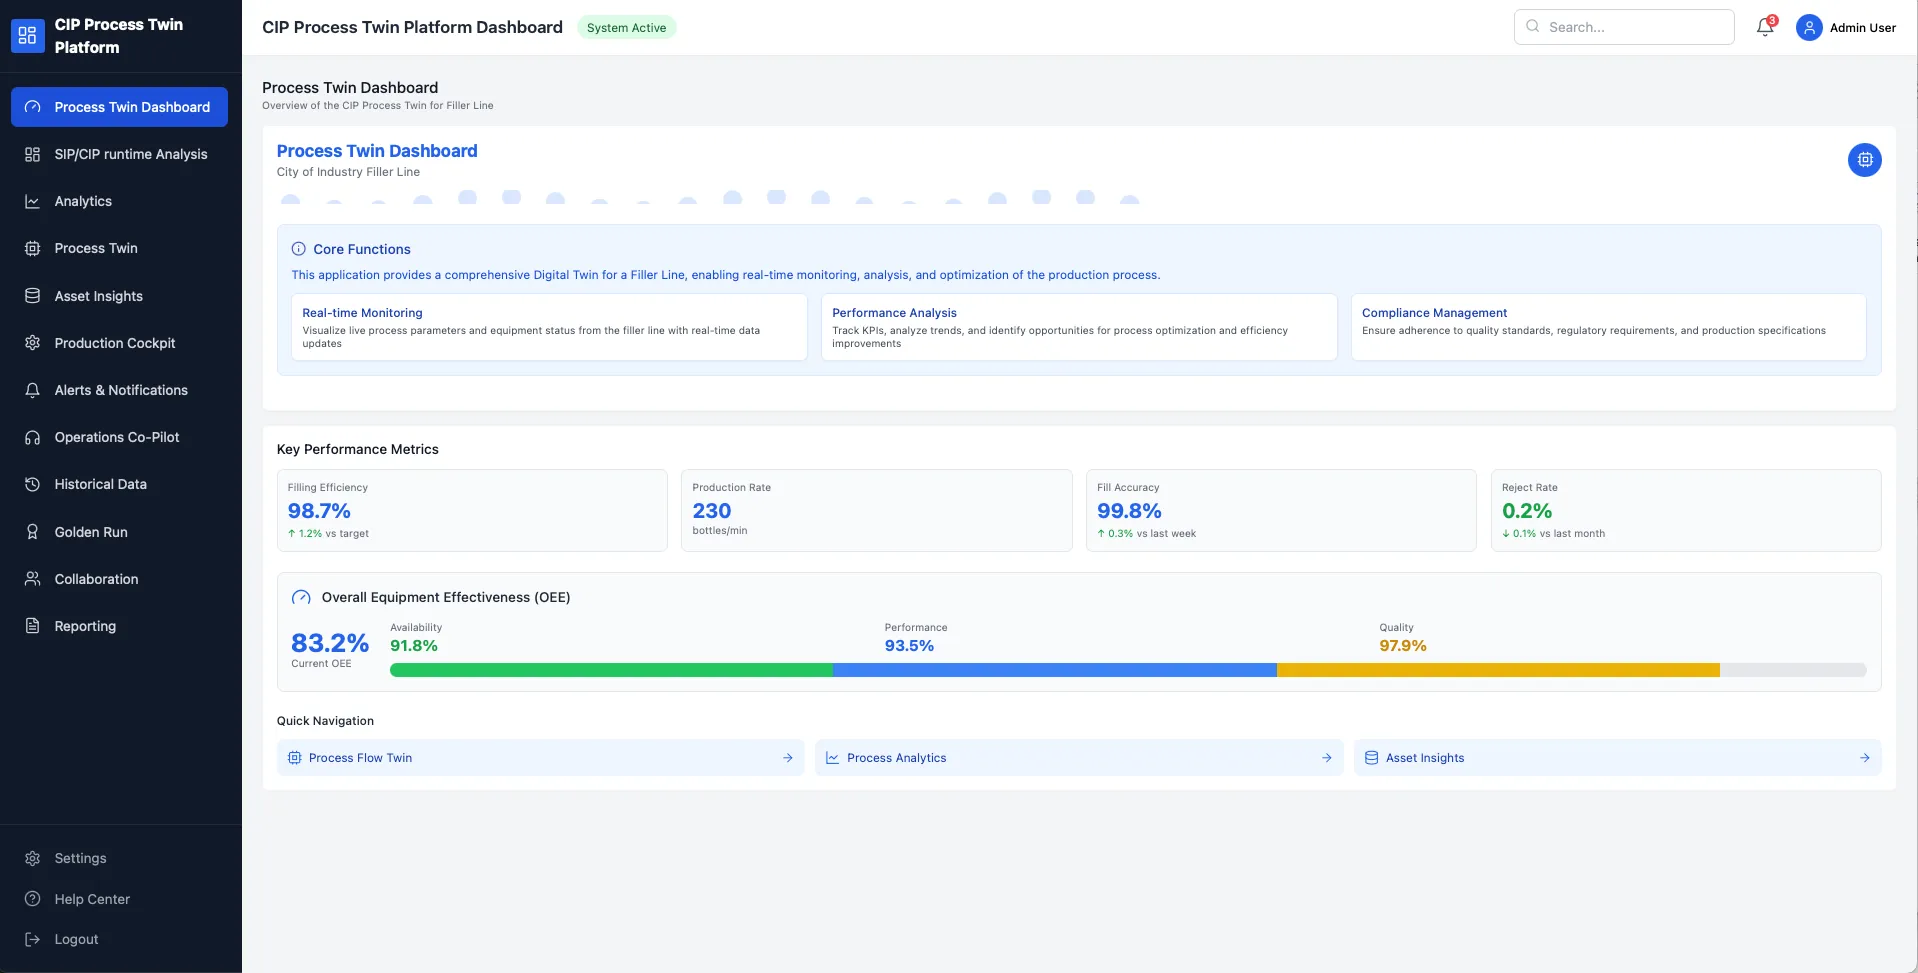
CIP/SIP and Asset Digital Twin
Food and Beverage
Pharmaceuticals and Life Sciences
CPG
SIP CIP Monitoring Dashboard for a beverage plant showing system active status, current step C4 Cooling at 89% complete, 3 of 12 steps completed, temperature 82°C, flow rate 125 L/min, and conductivity 450 µS/cm. Progress bars show concentration at 1.8%, flow rate slightly below 130 target, temperature slightly above 80 target, conductivity below 500 target, and cycle time adherence at 96.5%. Cycle steps include seal sterilization, draining, sterilization marked completed, cooling in progress, draining and production pending.
CIP SIP Monitoring
Food and Beverage
Pharmaceuticals and Life Sciences
CPG
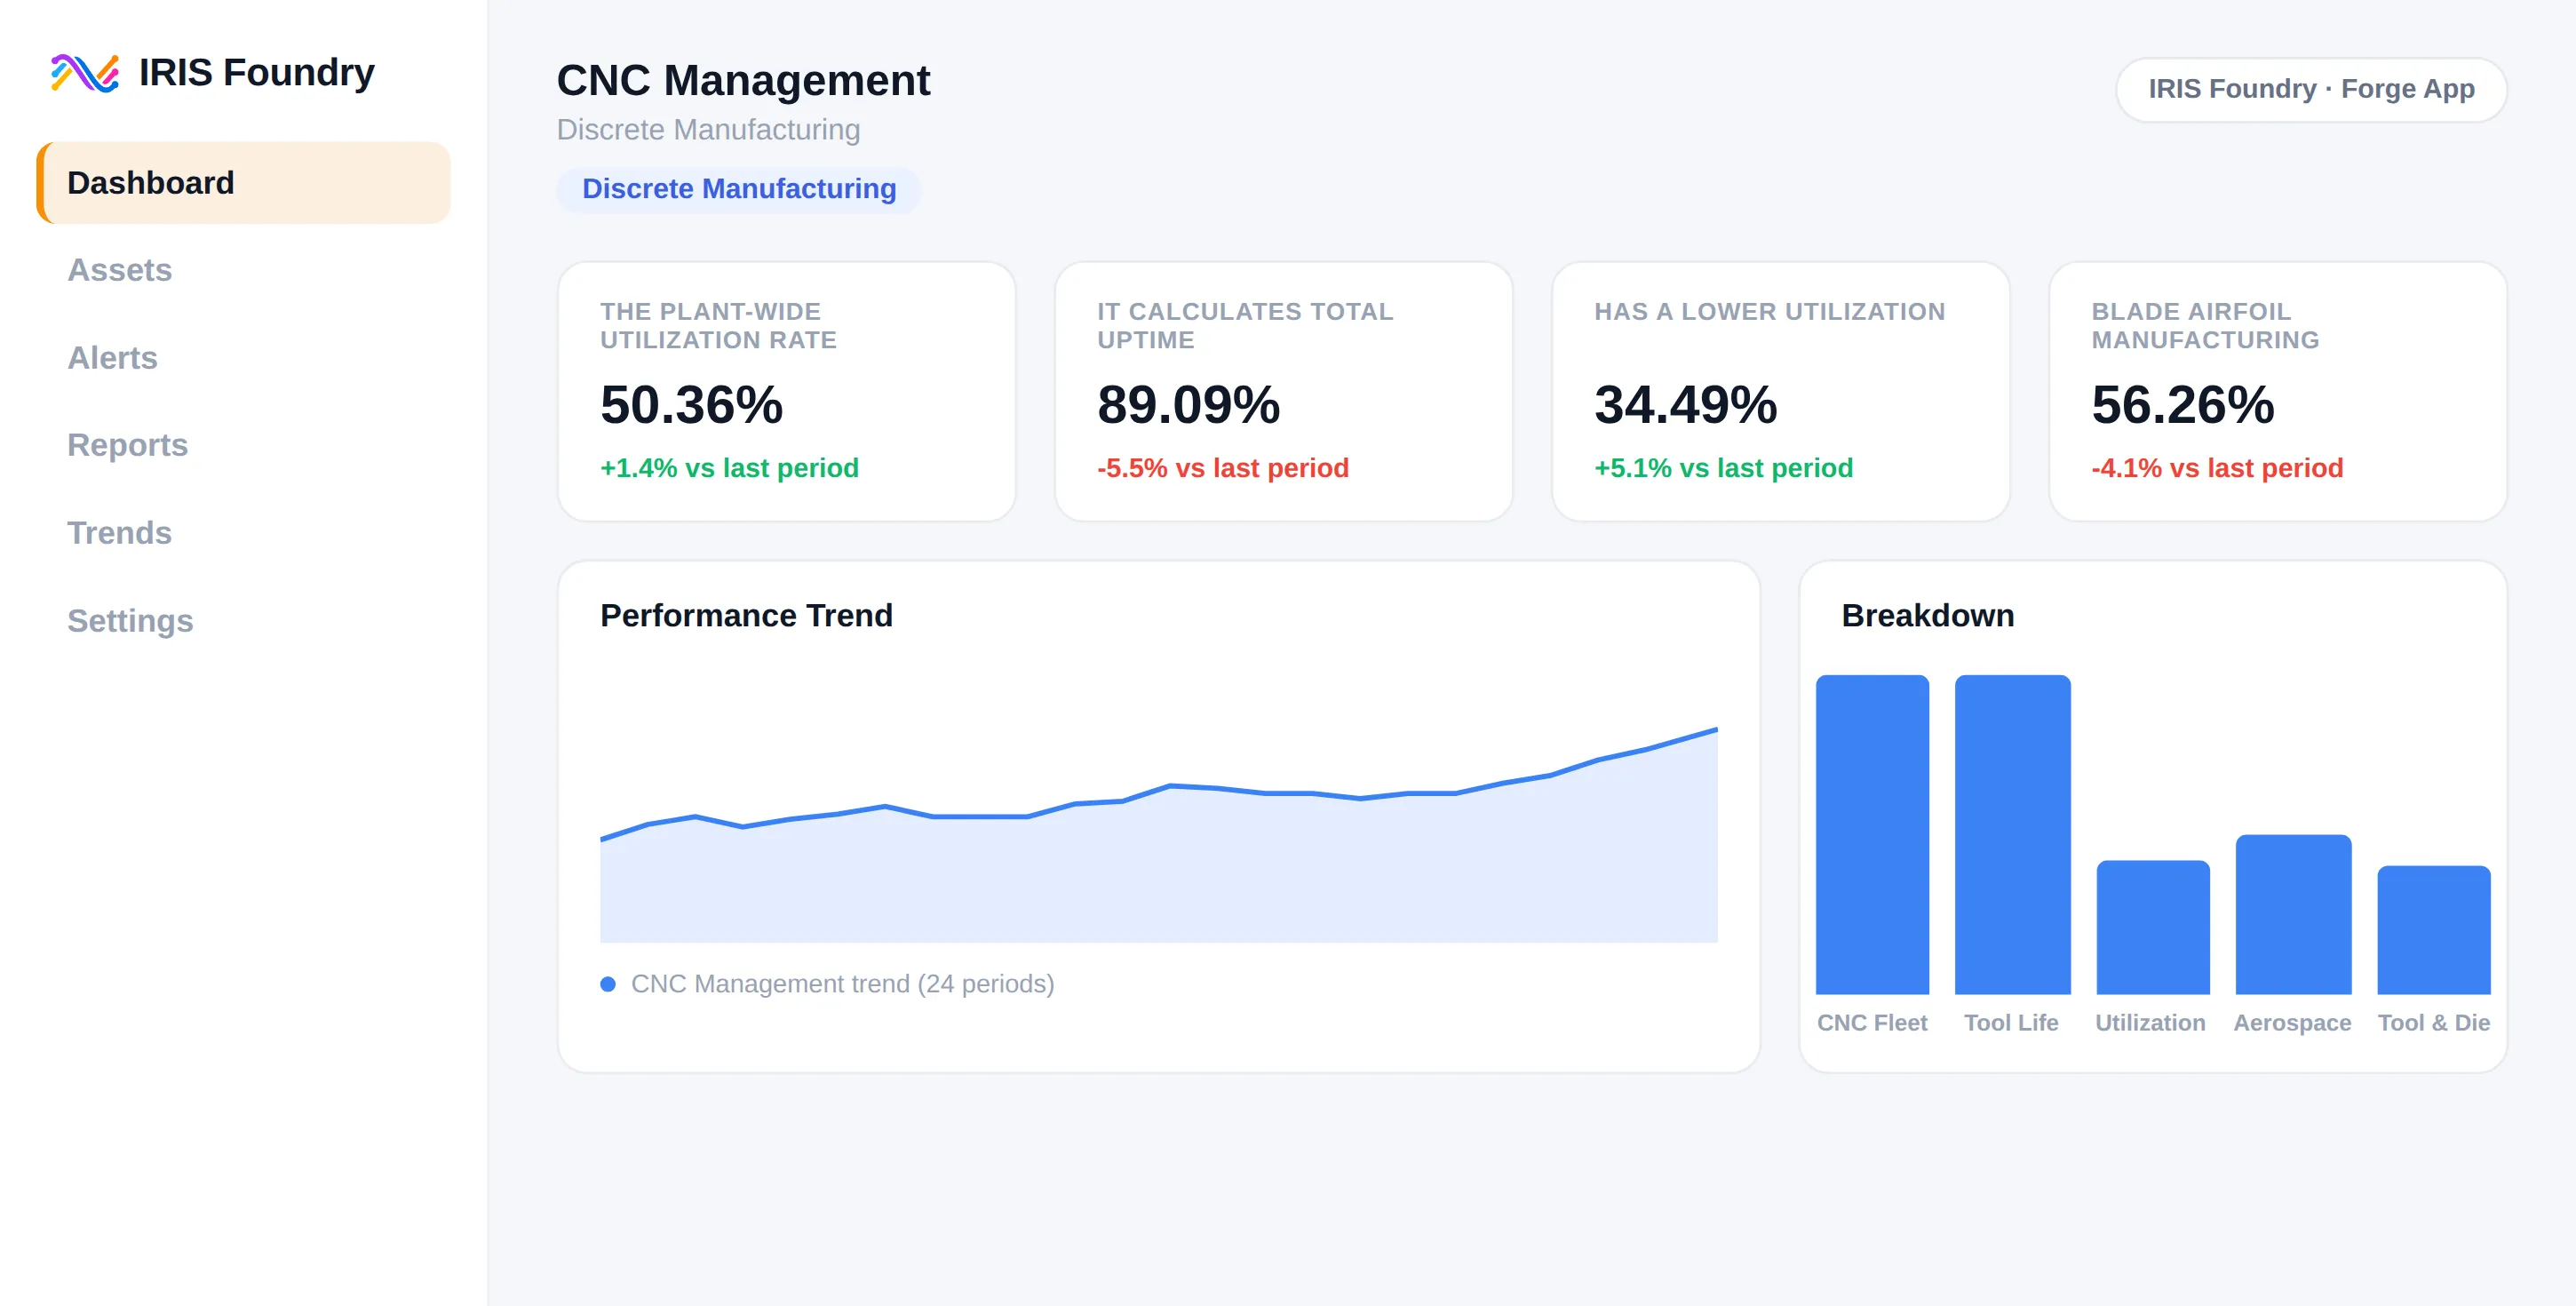
CNC Management
Discrete Manufacturing
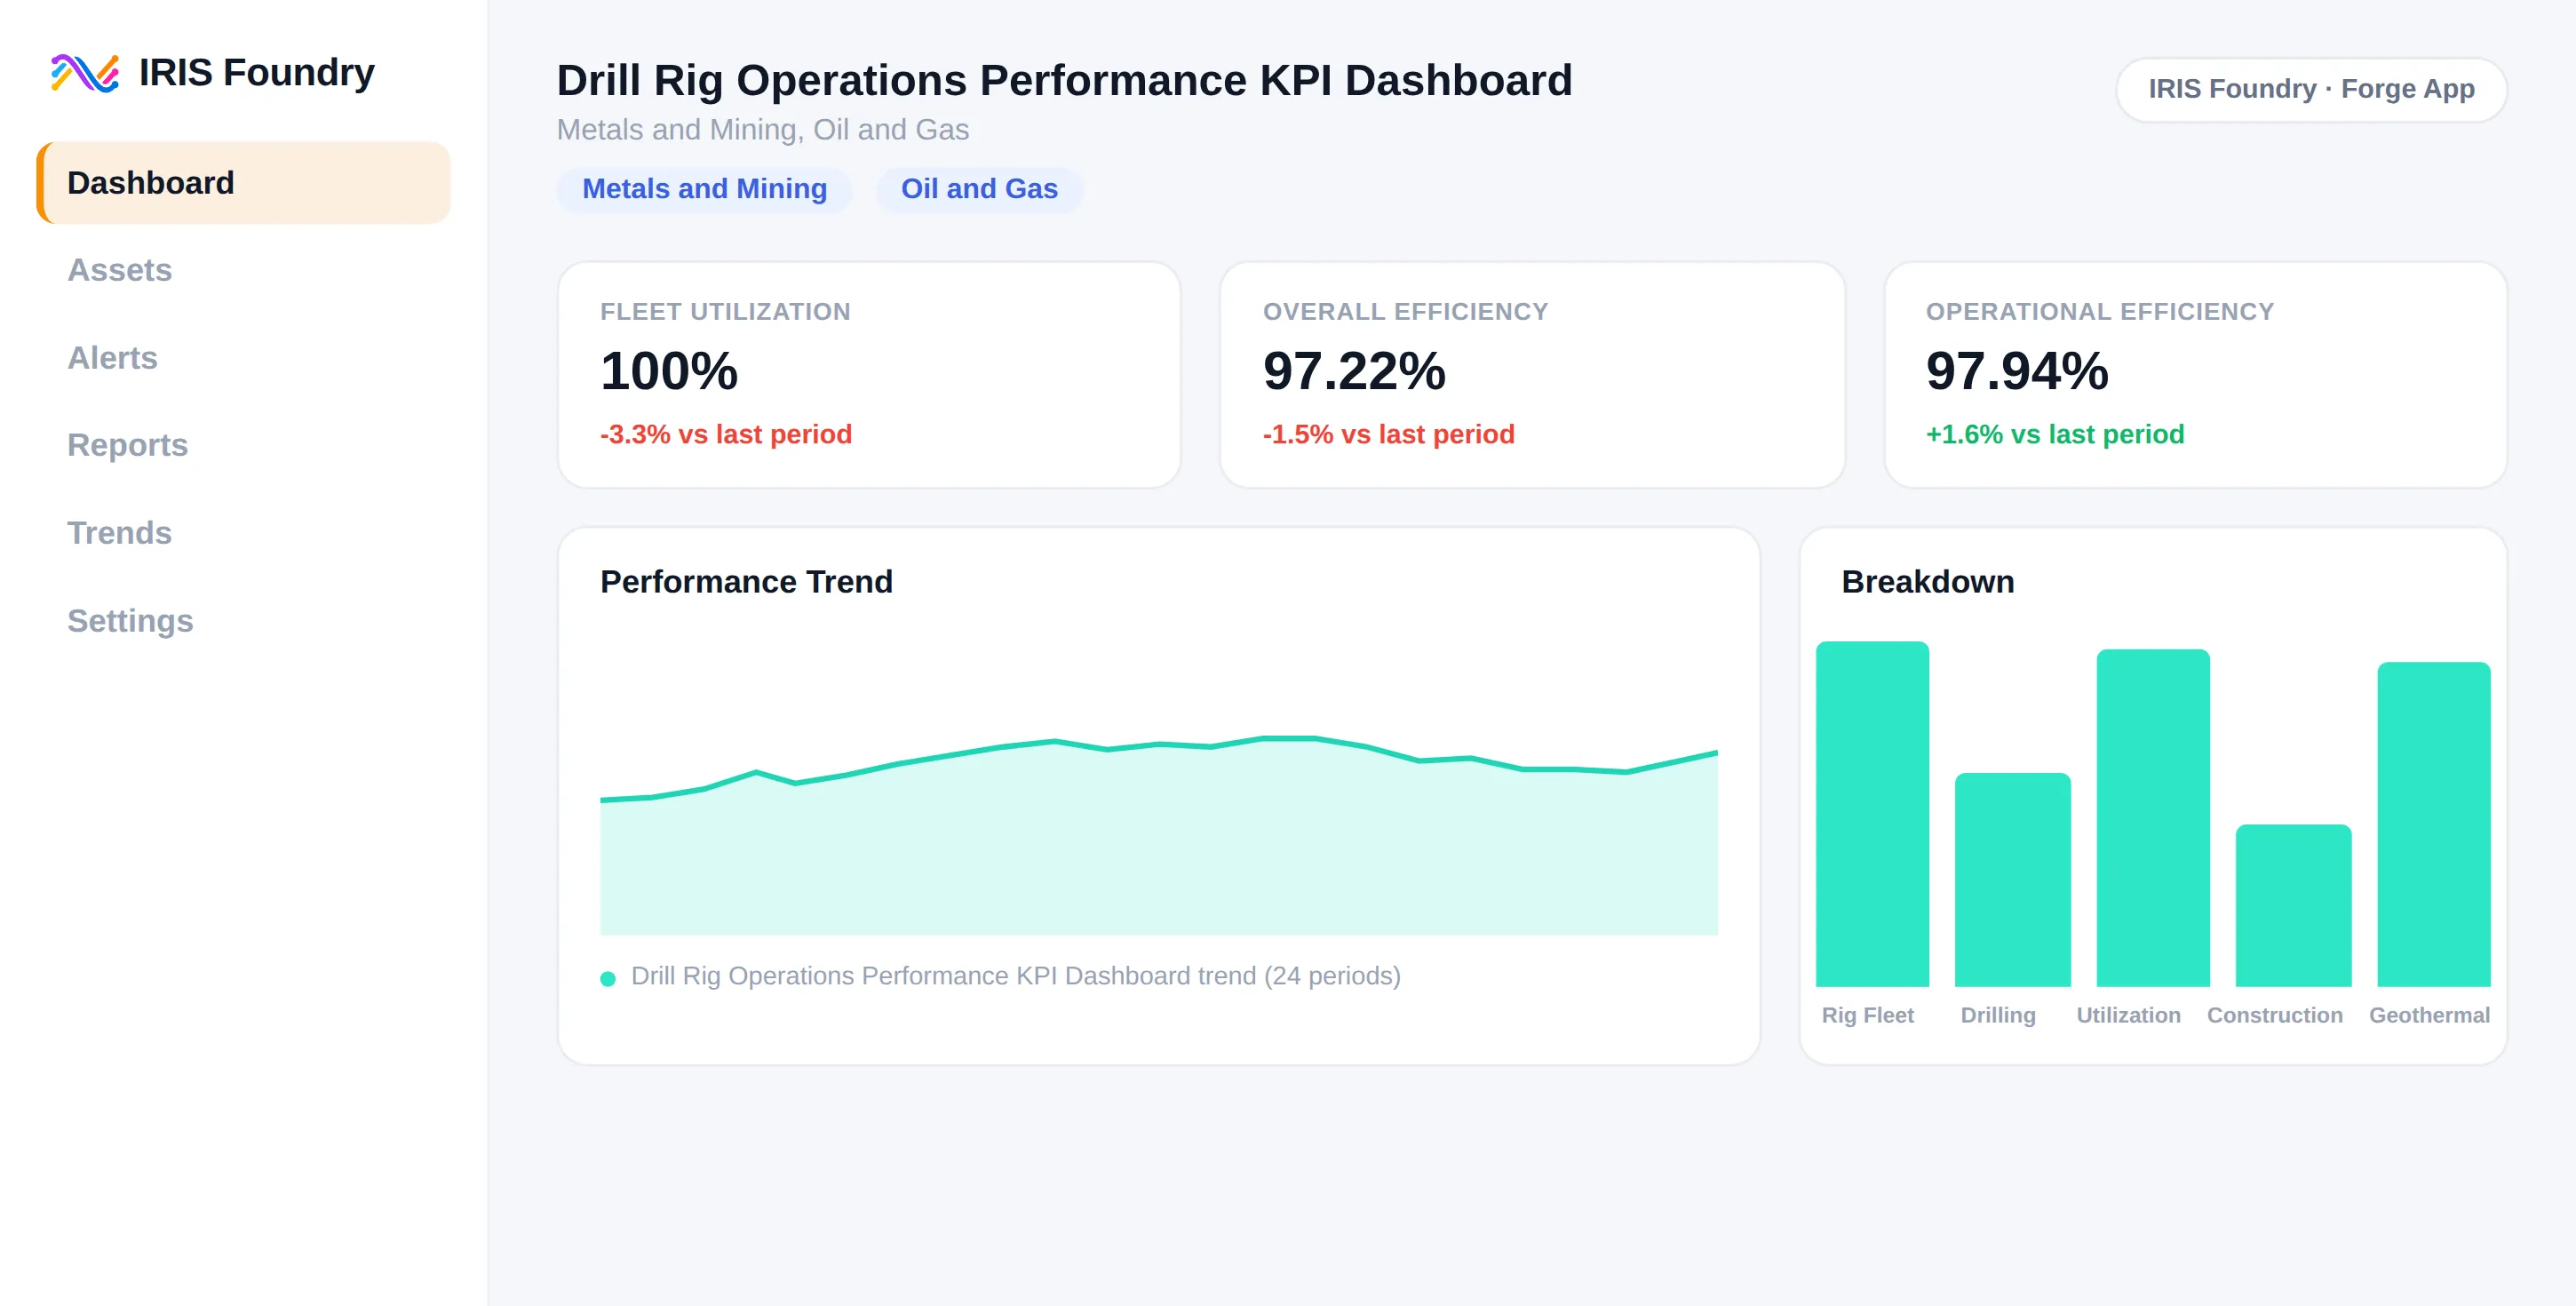
Drill Rig Operations Performance KPI Dashboard
Metals and Mining
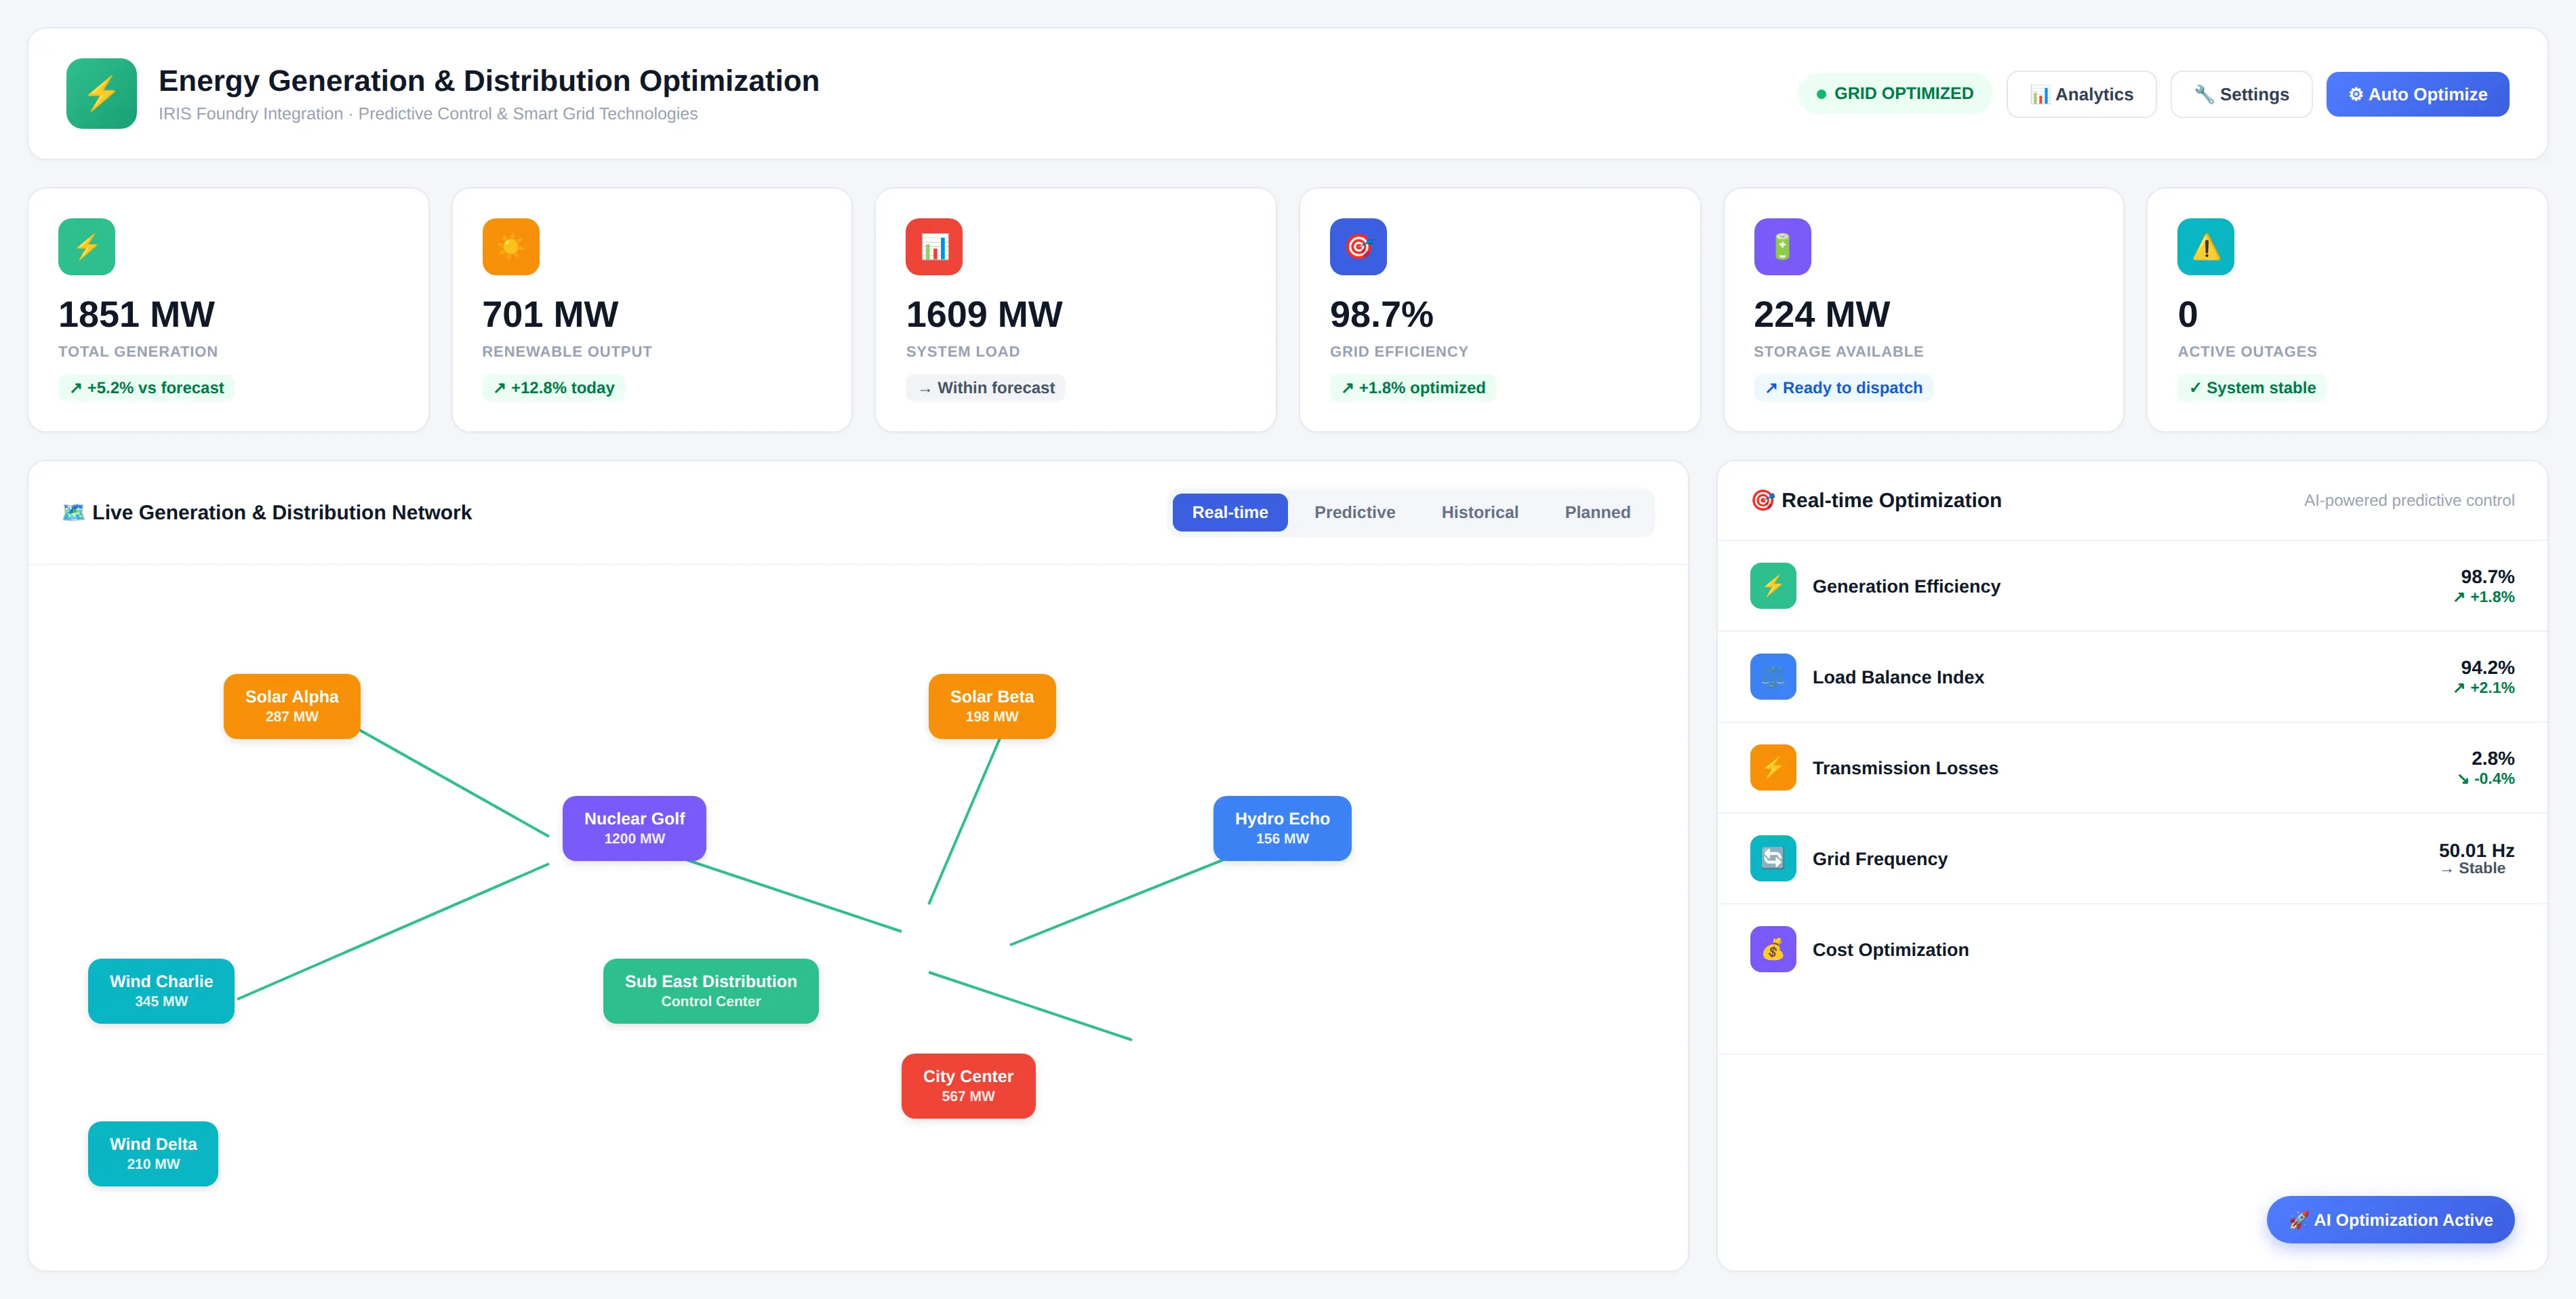
Energy Generation and Distribution Optimization Agent
Energy
Utilities
Dashboard of EnergyIQ platform showing ESG Metrics for the Main Production Plant with Environmental score 72, Social 68, Governance 85. Environmental tab selected displaying carbon emissions 12,450 tons CO2e against 10,000 target, energy intensity 0.85 kWh/unit against 0.75 target, water usage 78,500 liters/day against 70,000 target, renewable energy mix 22% against 30% target, and waste recycling rate 68% against 80% target. Progress bars and upward/downward trends shown, timeframe set to Quarter.
Energy Ops
Energy
Utilities
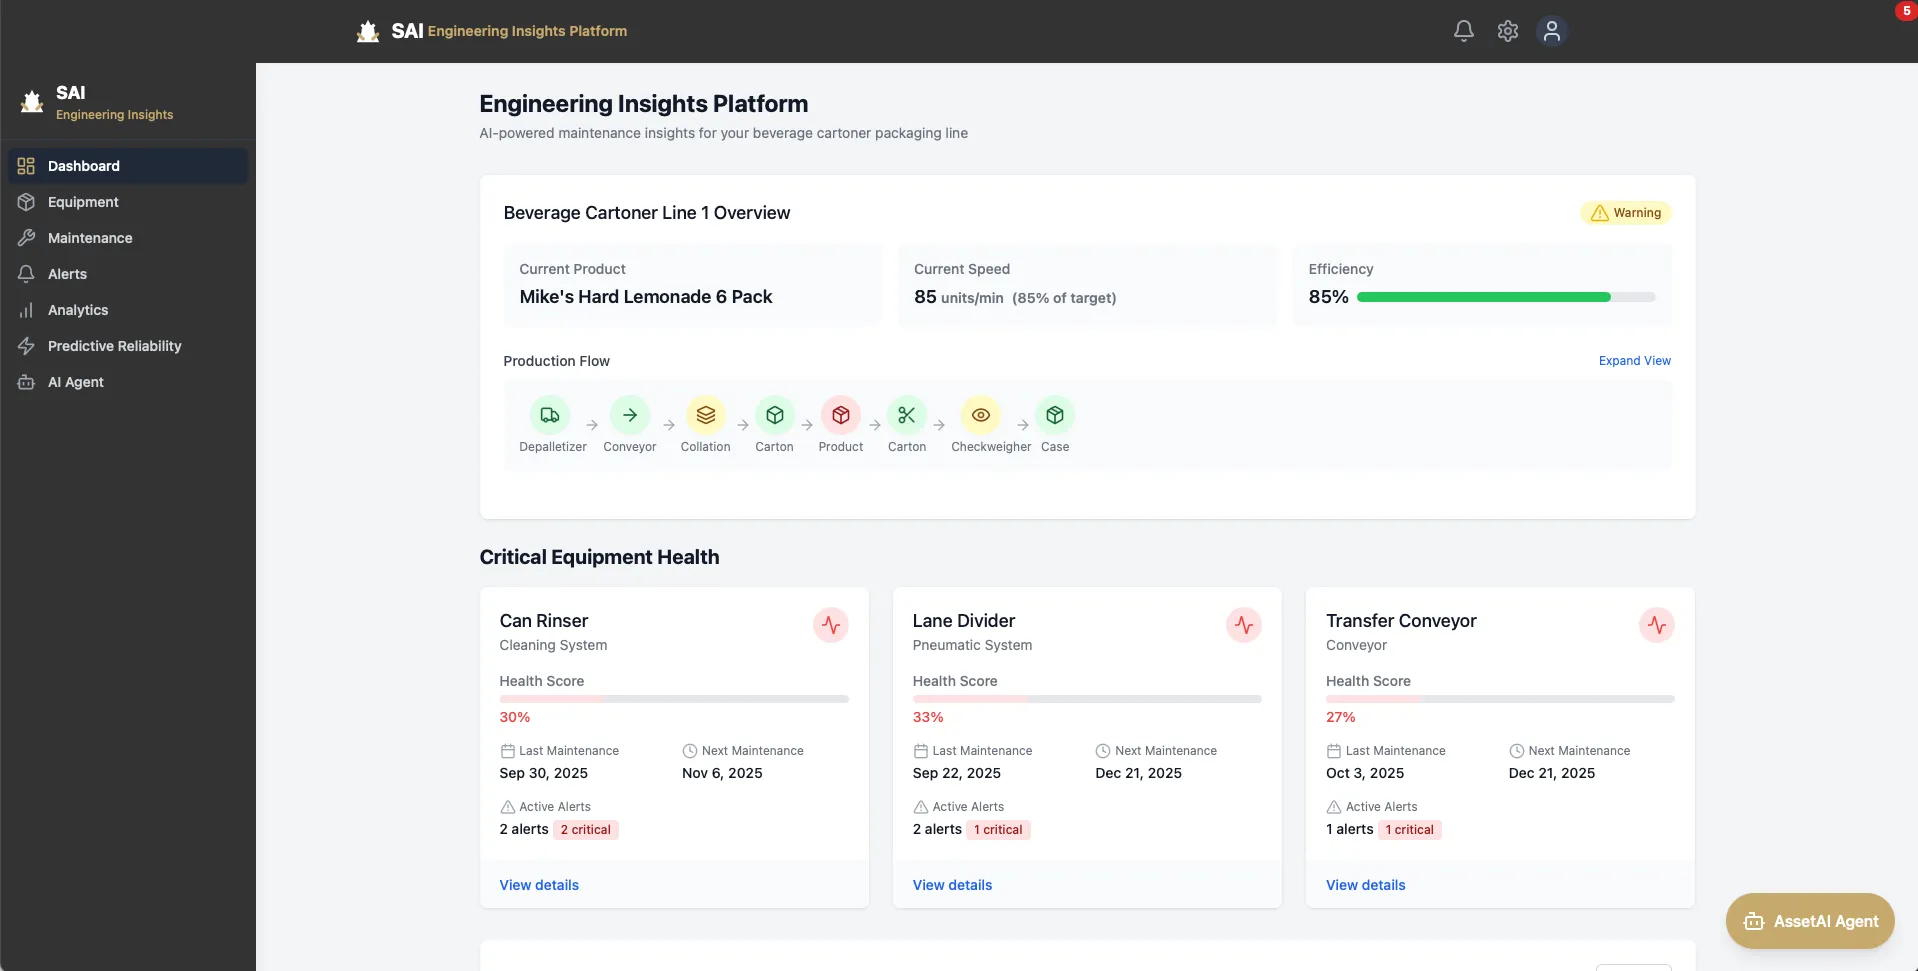
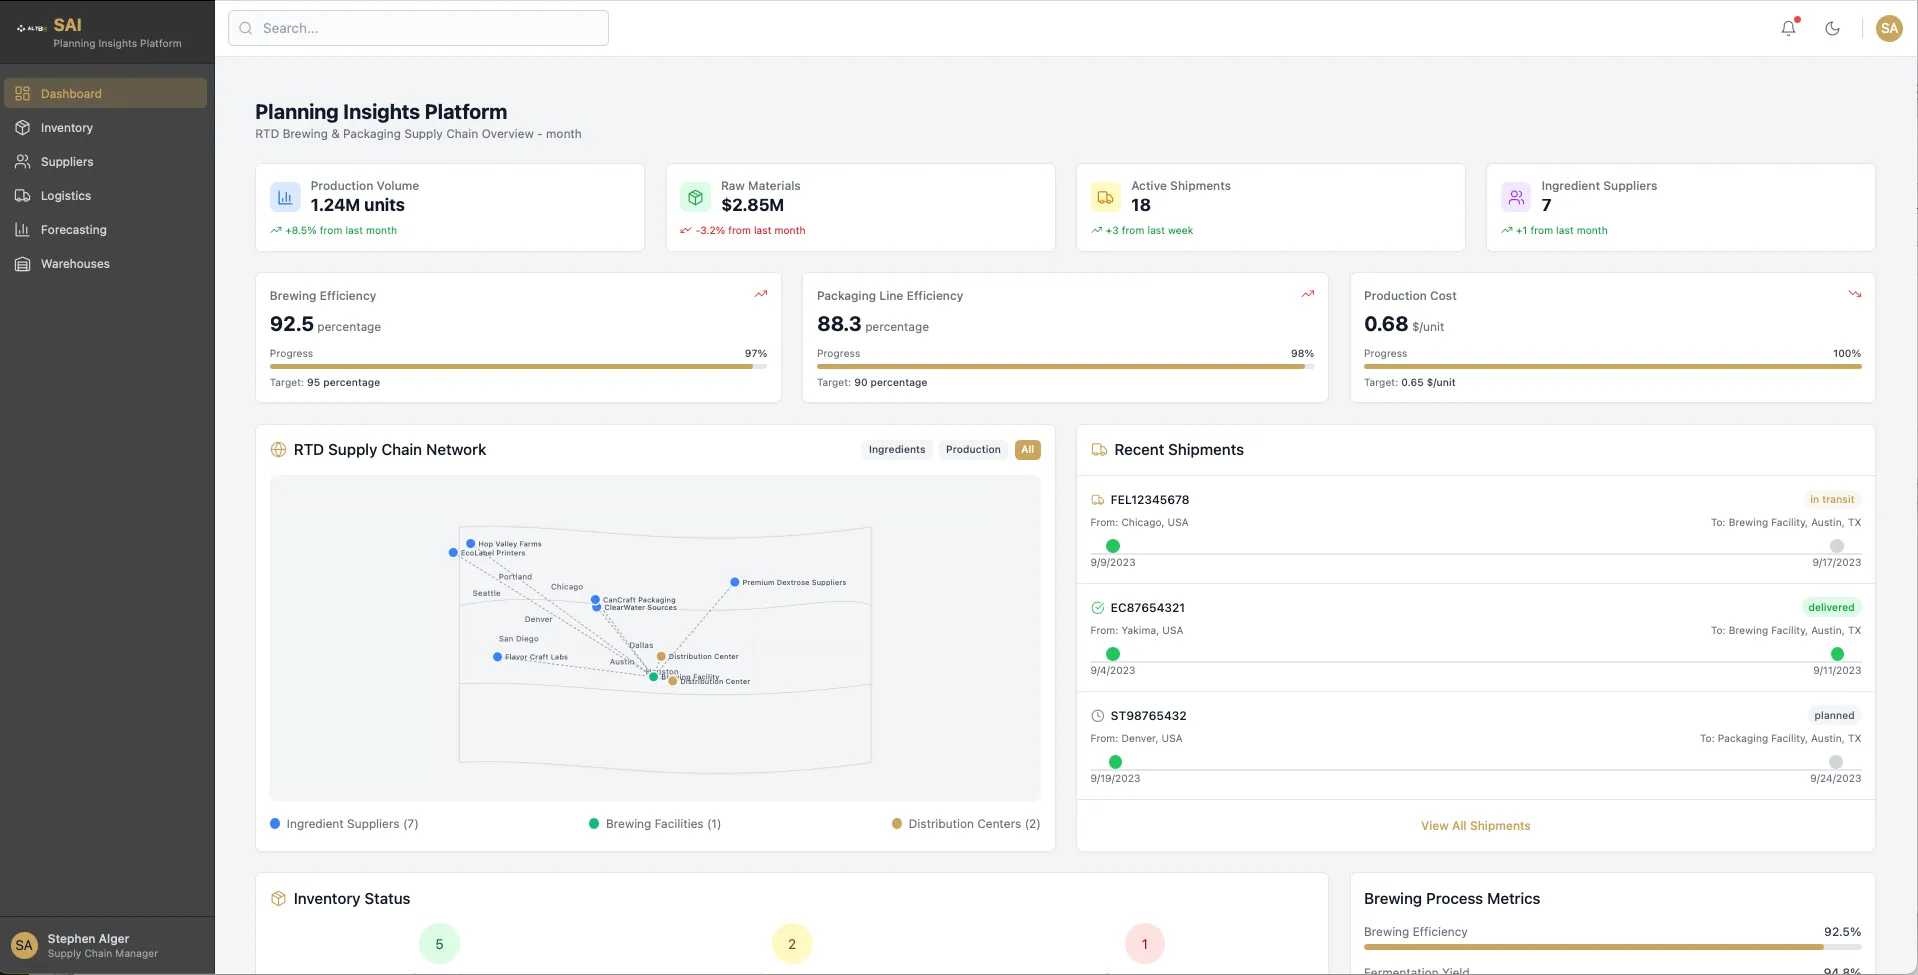
Engineering Insights Platform
Food and Beverage
CPG
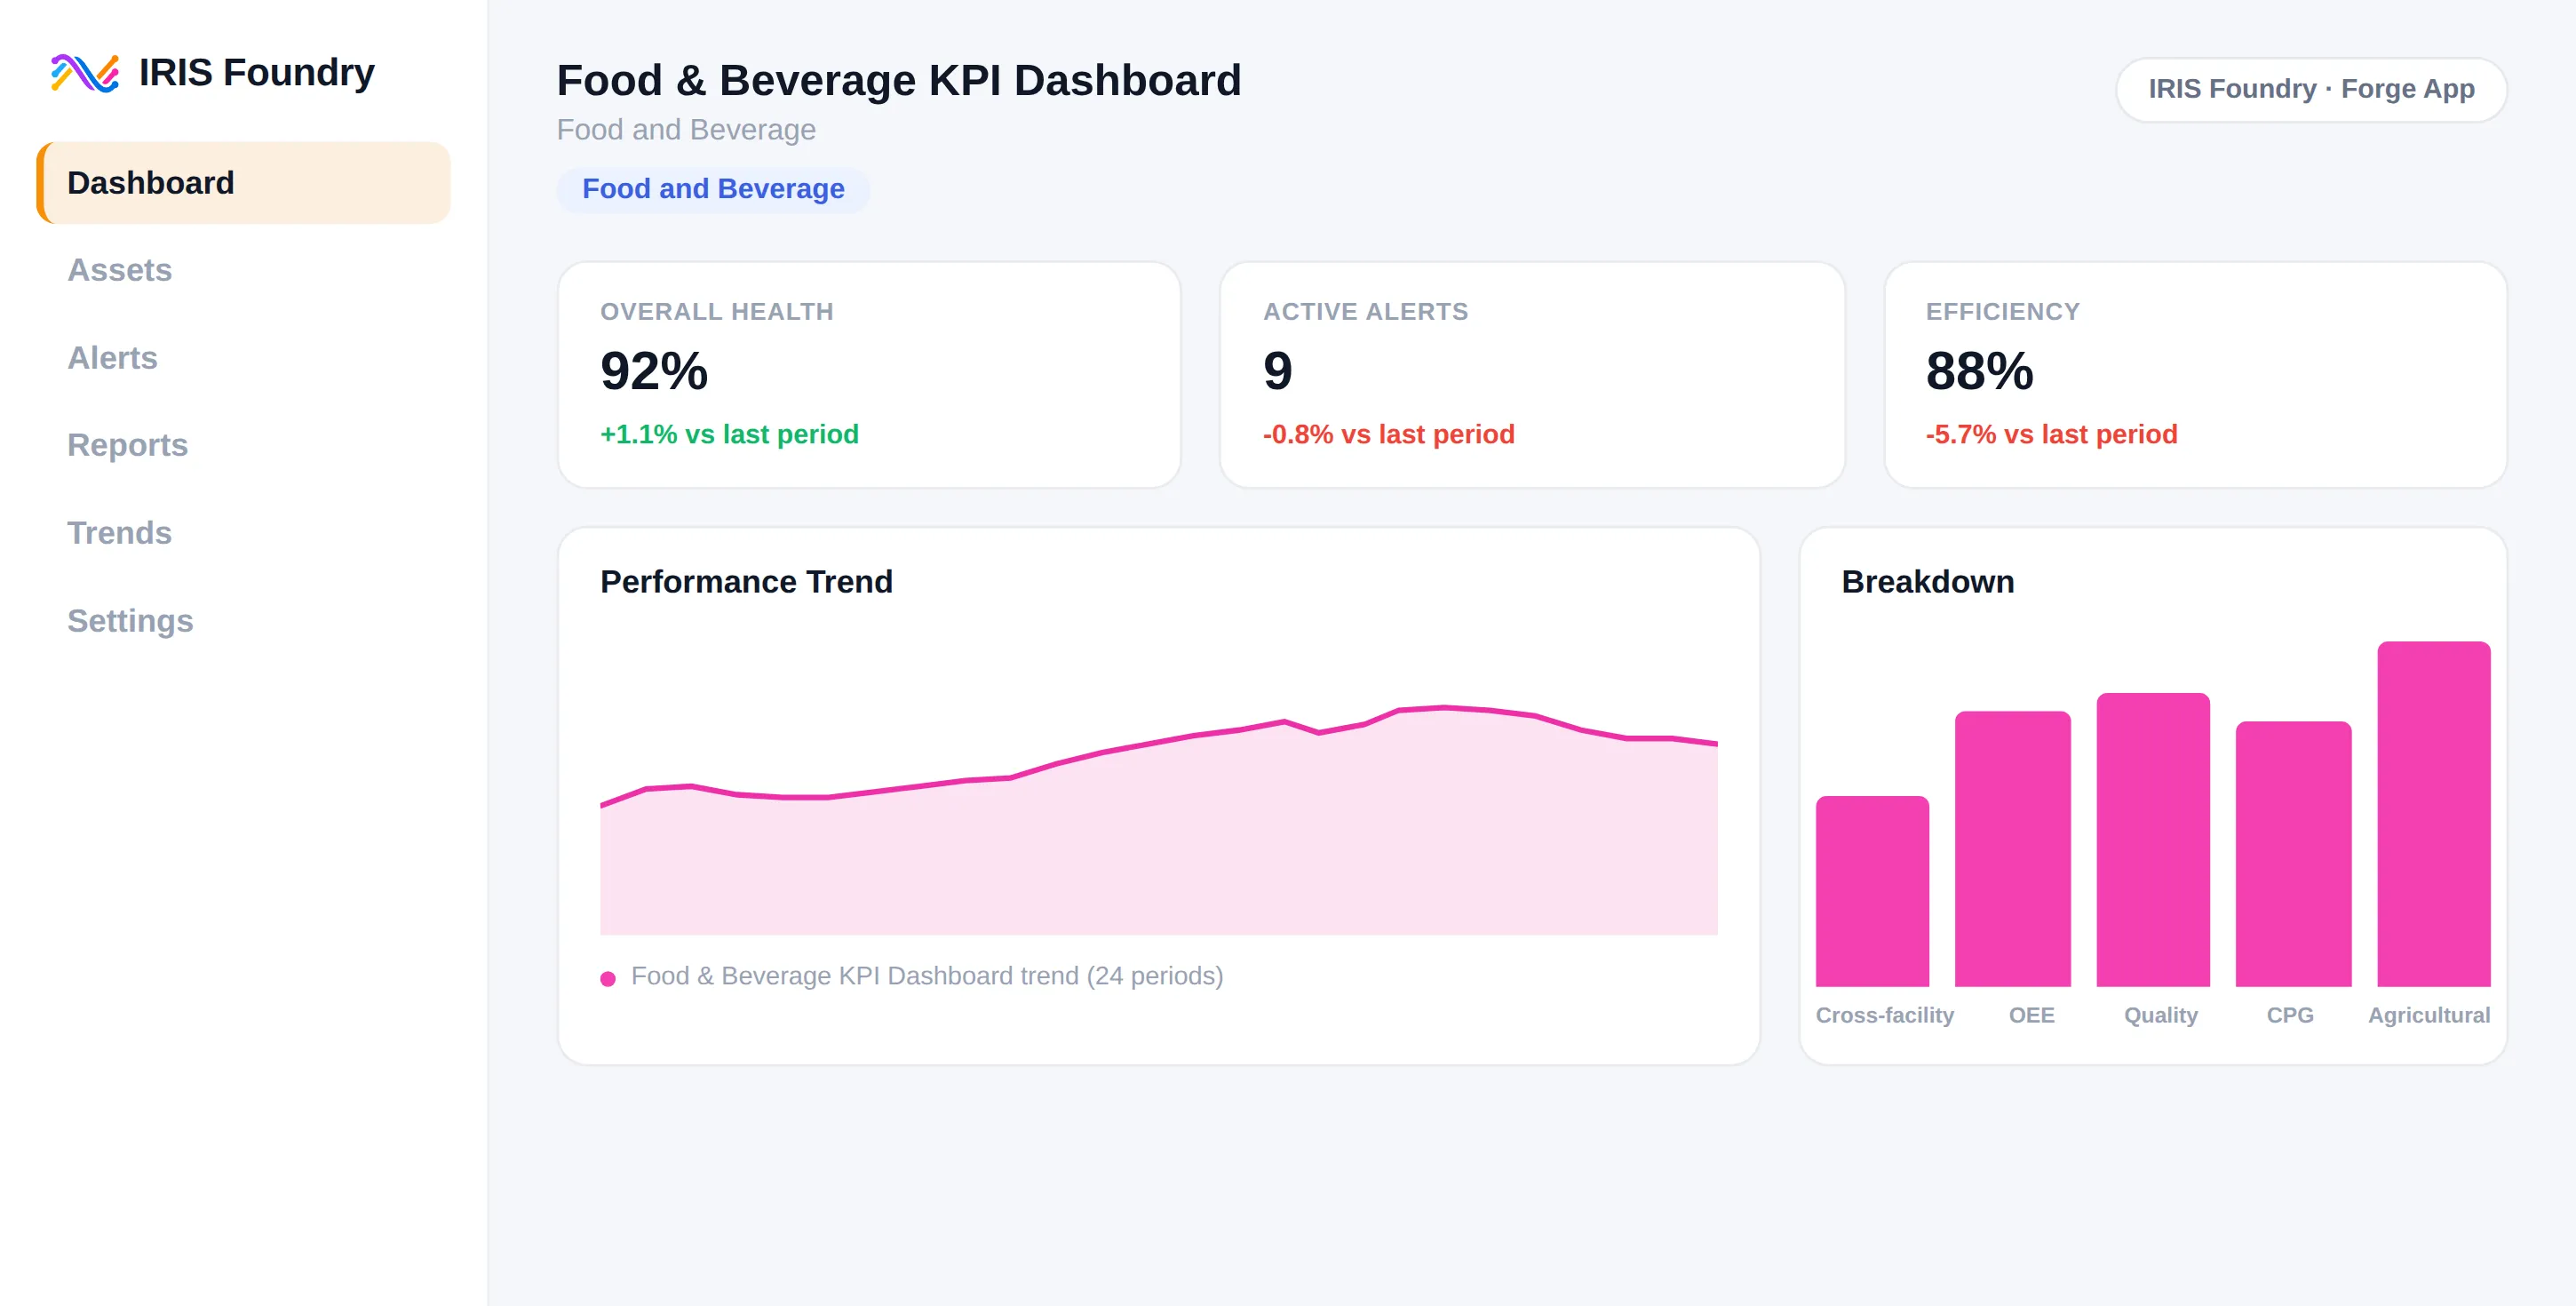
Food and Beverage KPI Dashboard
Food and Beverage
CPG
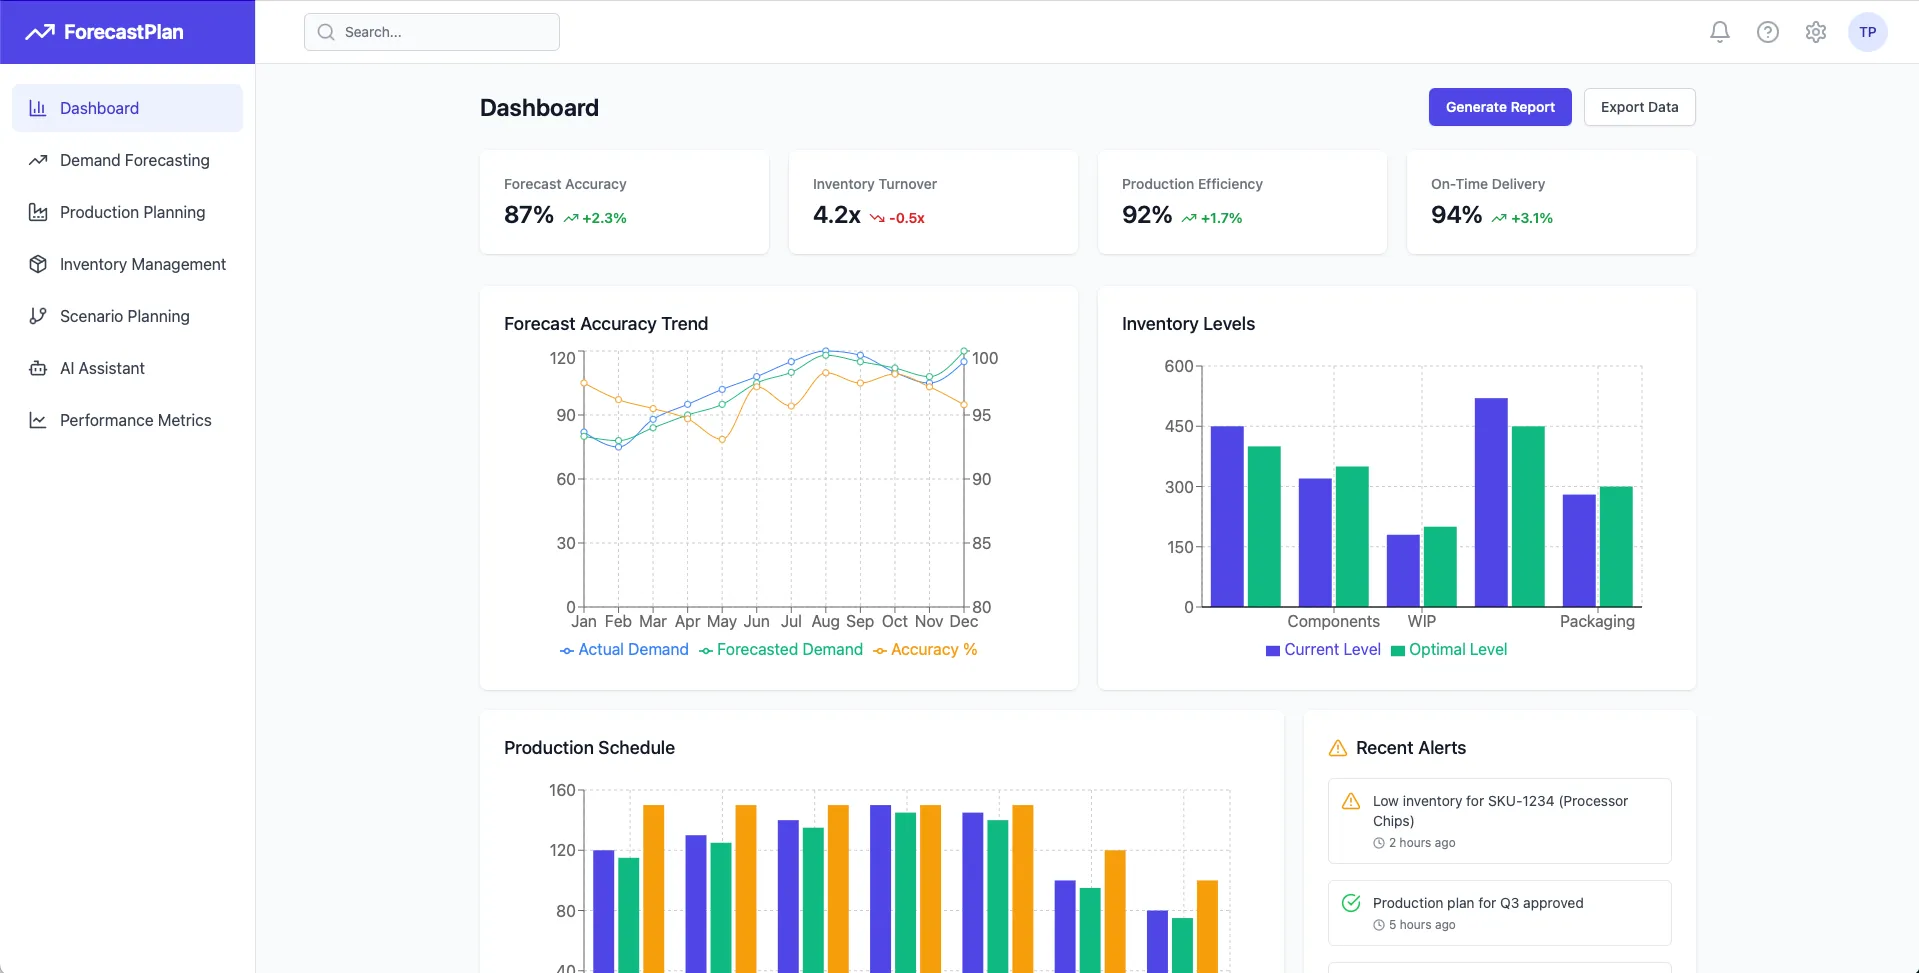
Forecasting and Planning App
Food and Beverage
CPG
ForecastPlan
Discrete Manufacturing
CPG
Food and Beverage
Chemical
Pharmaceuticals and Life Sciences
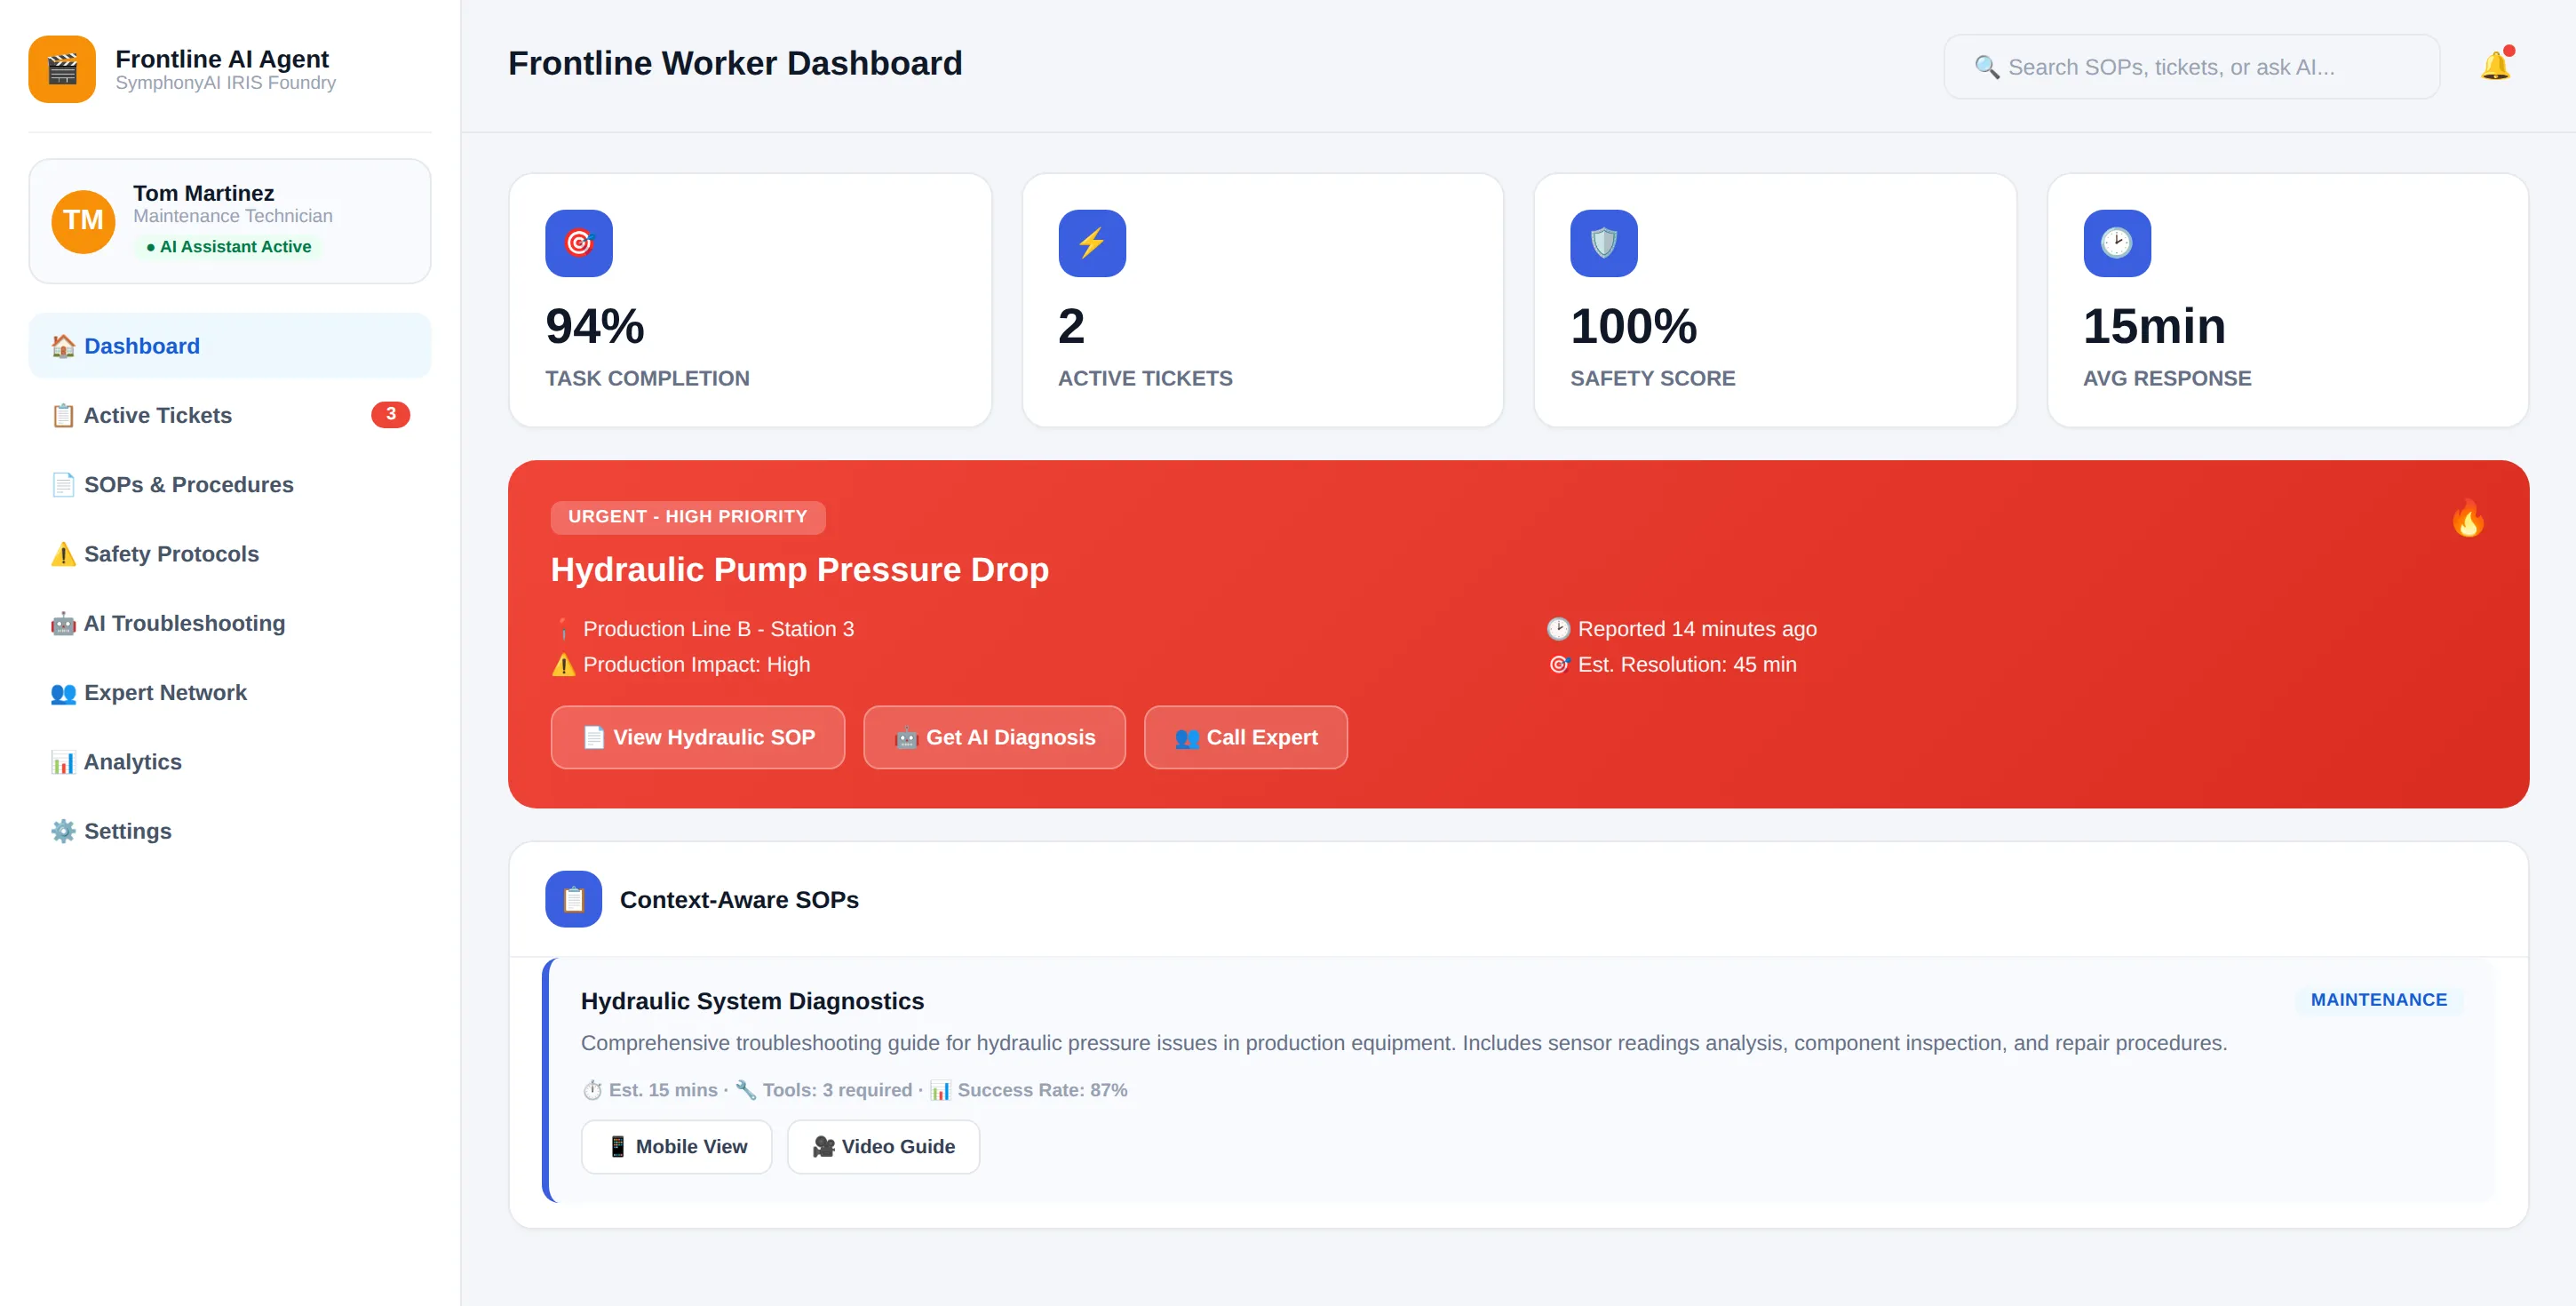
Frontline Worker Agent
Discrete Manufacturing
Oil and Gas
Utilities
CPG
Pharmaceuticals and Life Sciences
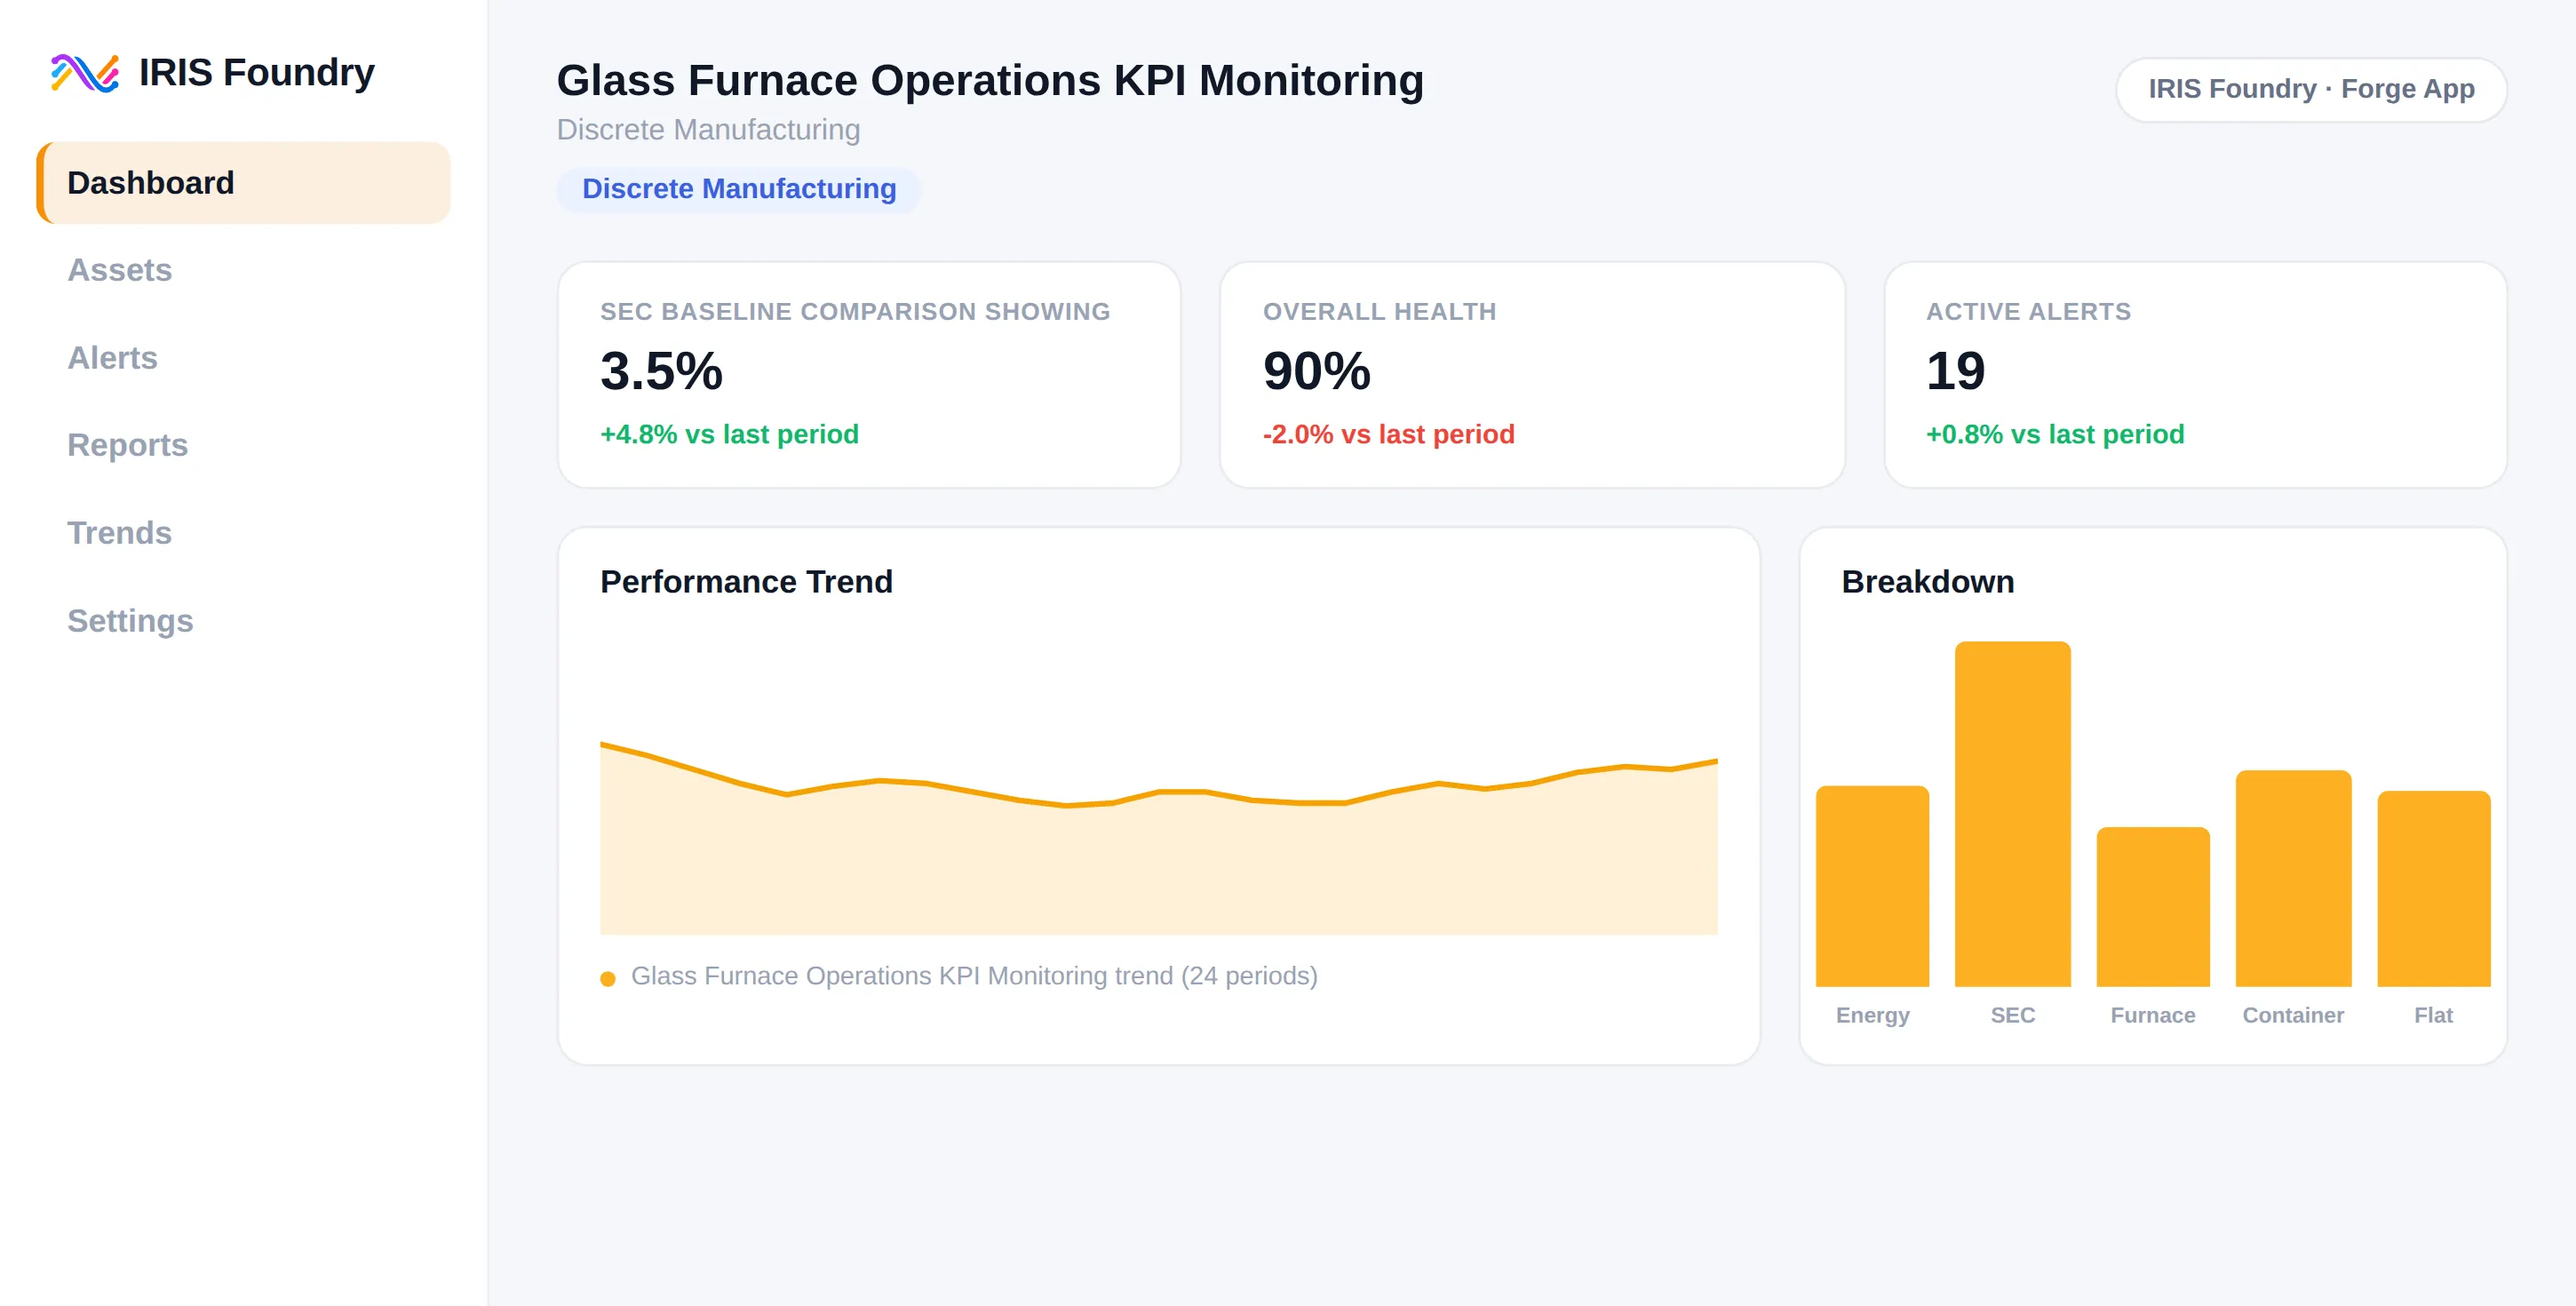
Glass Furnace Operations KPI Monitoring
Discrete Manufacturing
CPG
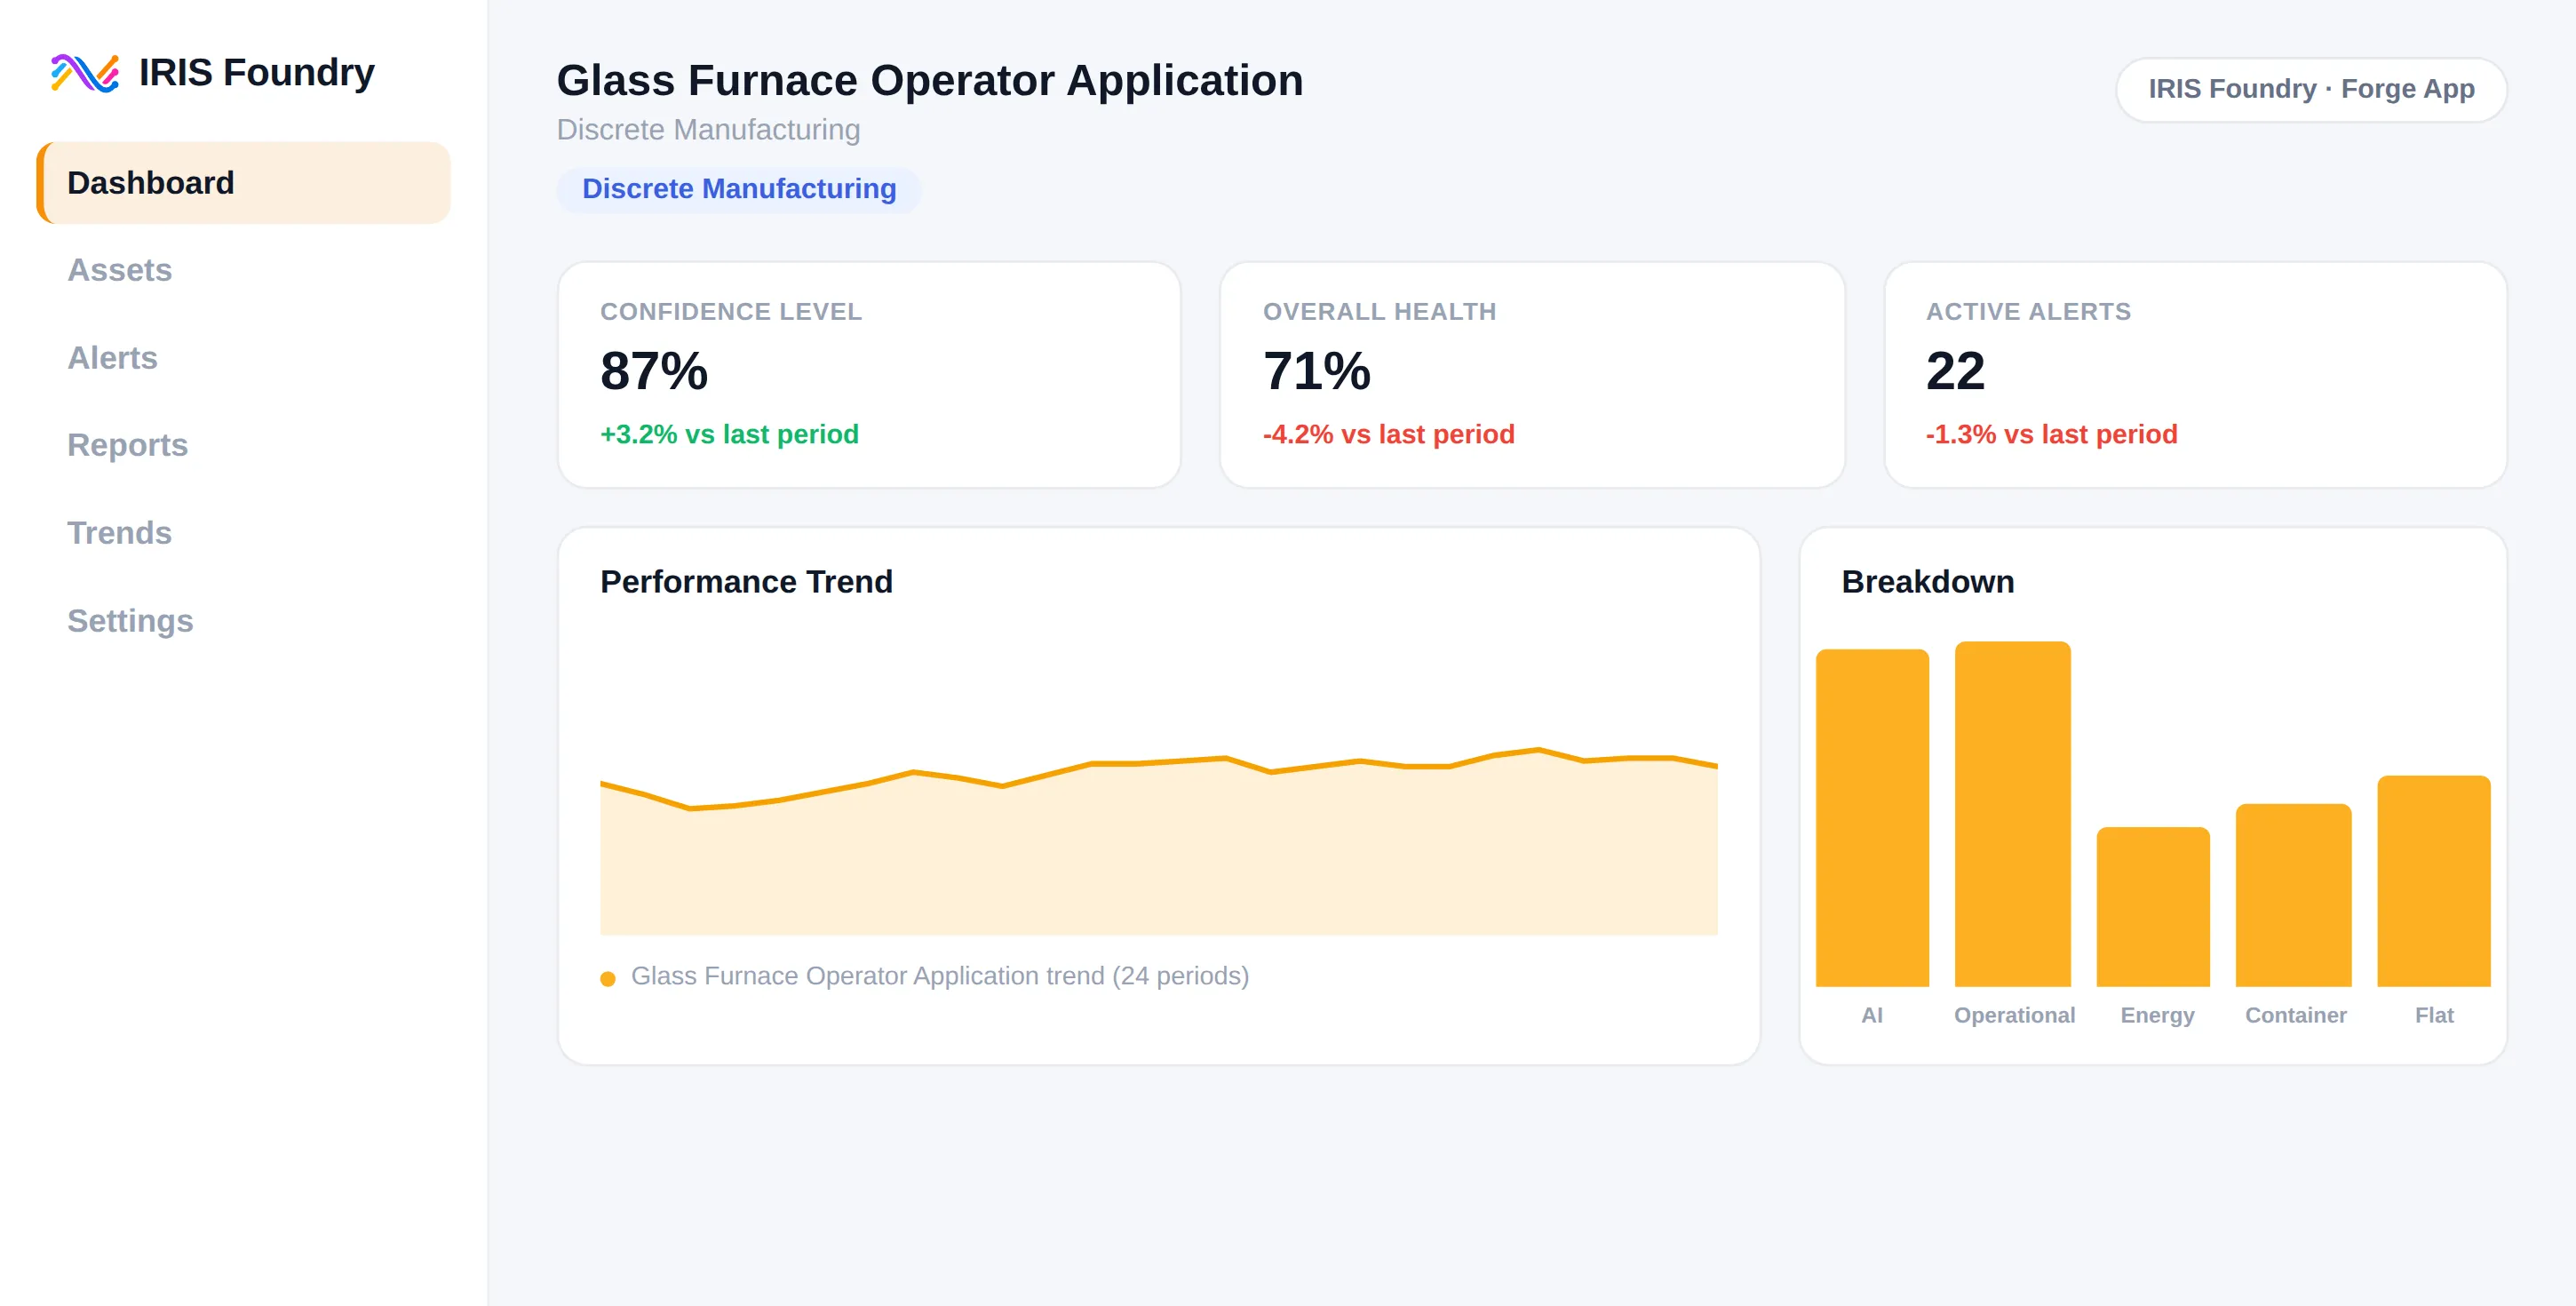
Glass Furnace Operator Application
Discrete Manufacturing
CPG
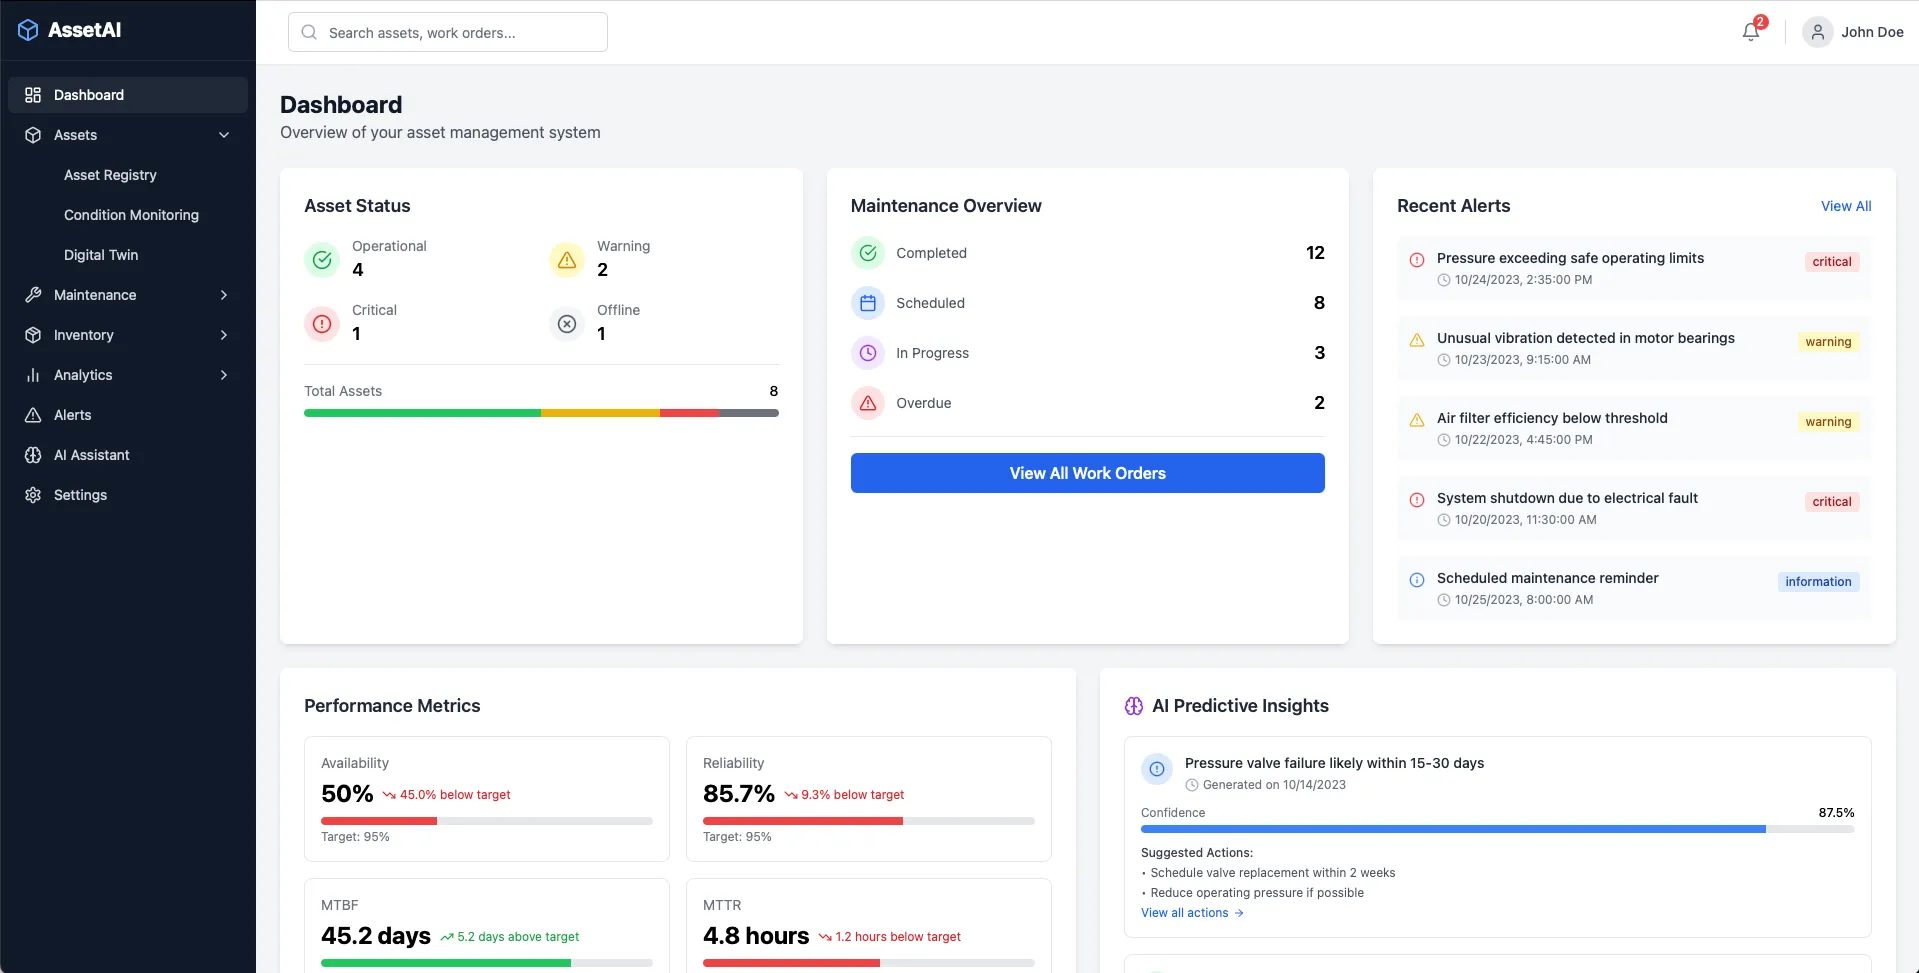
AssetAI asset health dashboard
Industrial Asset Management (AssetAI)
Discrete Manufacturing
Utilities
Energy
CPG
Pharmaceuticals and Life Sciences
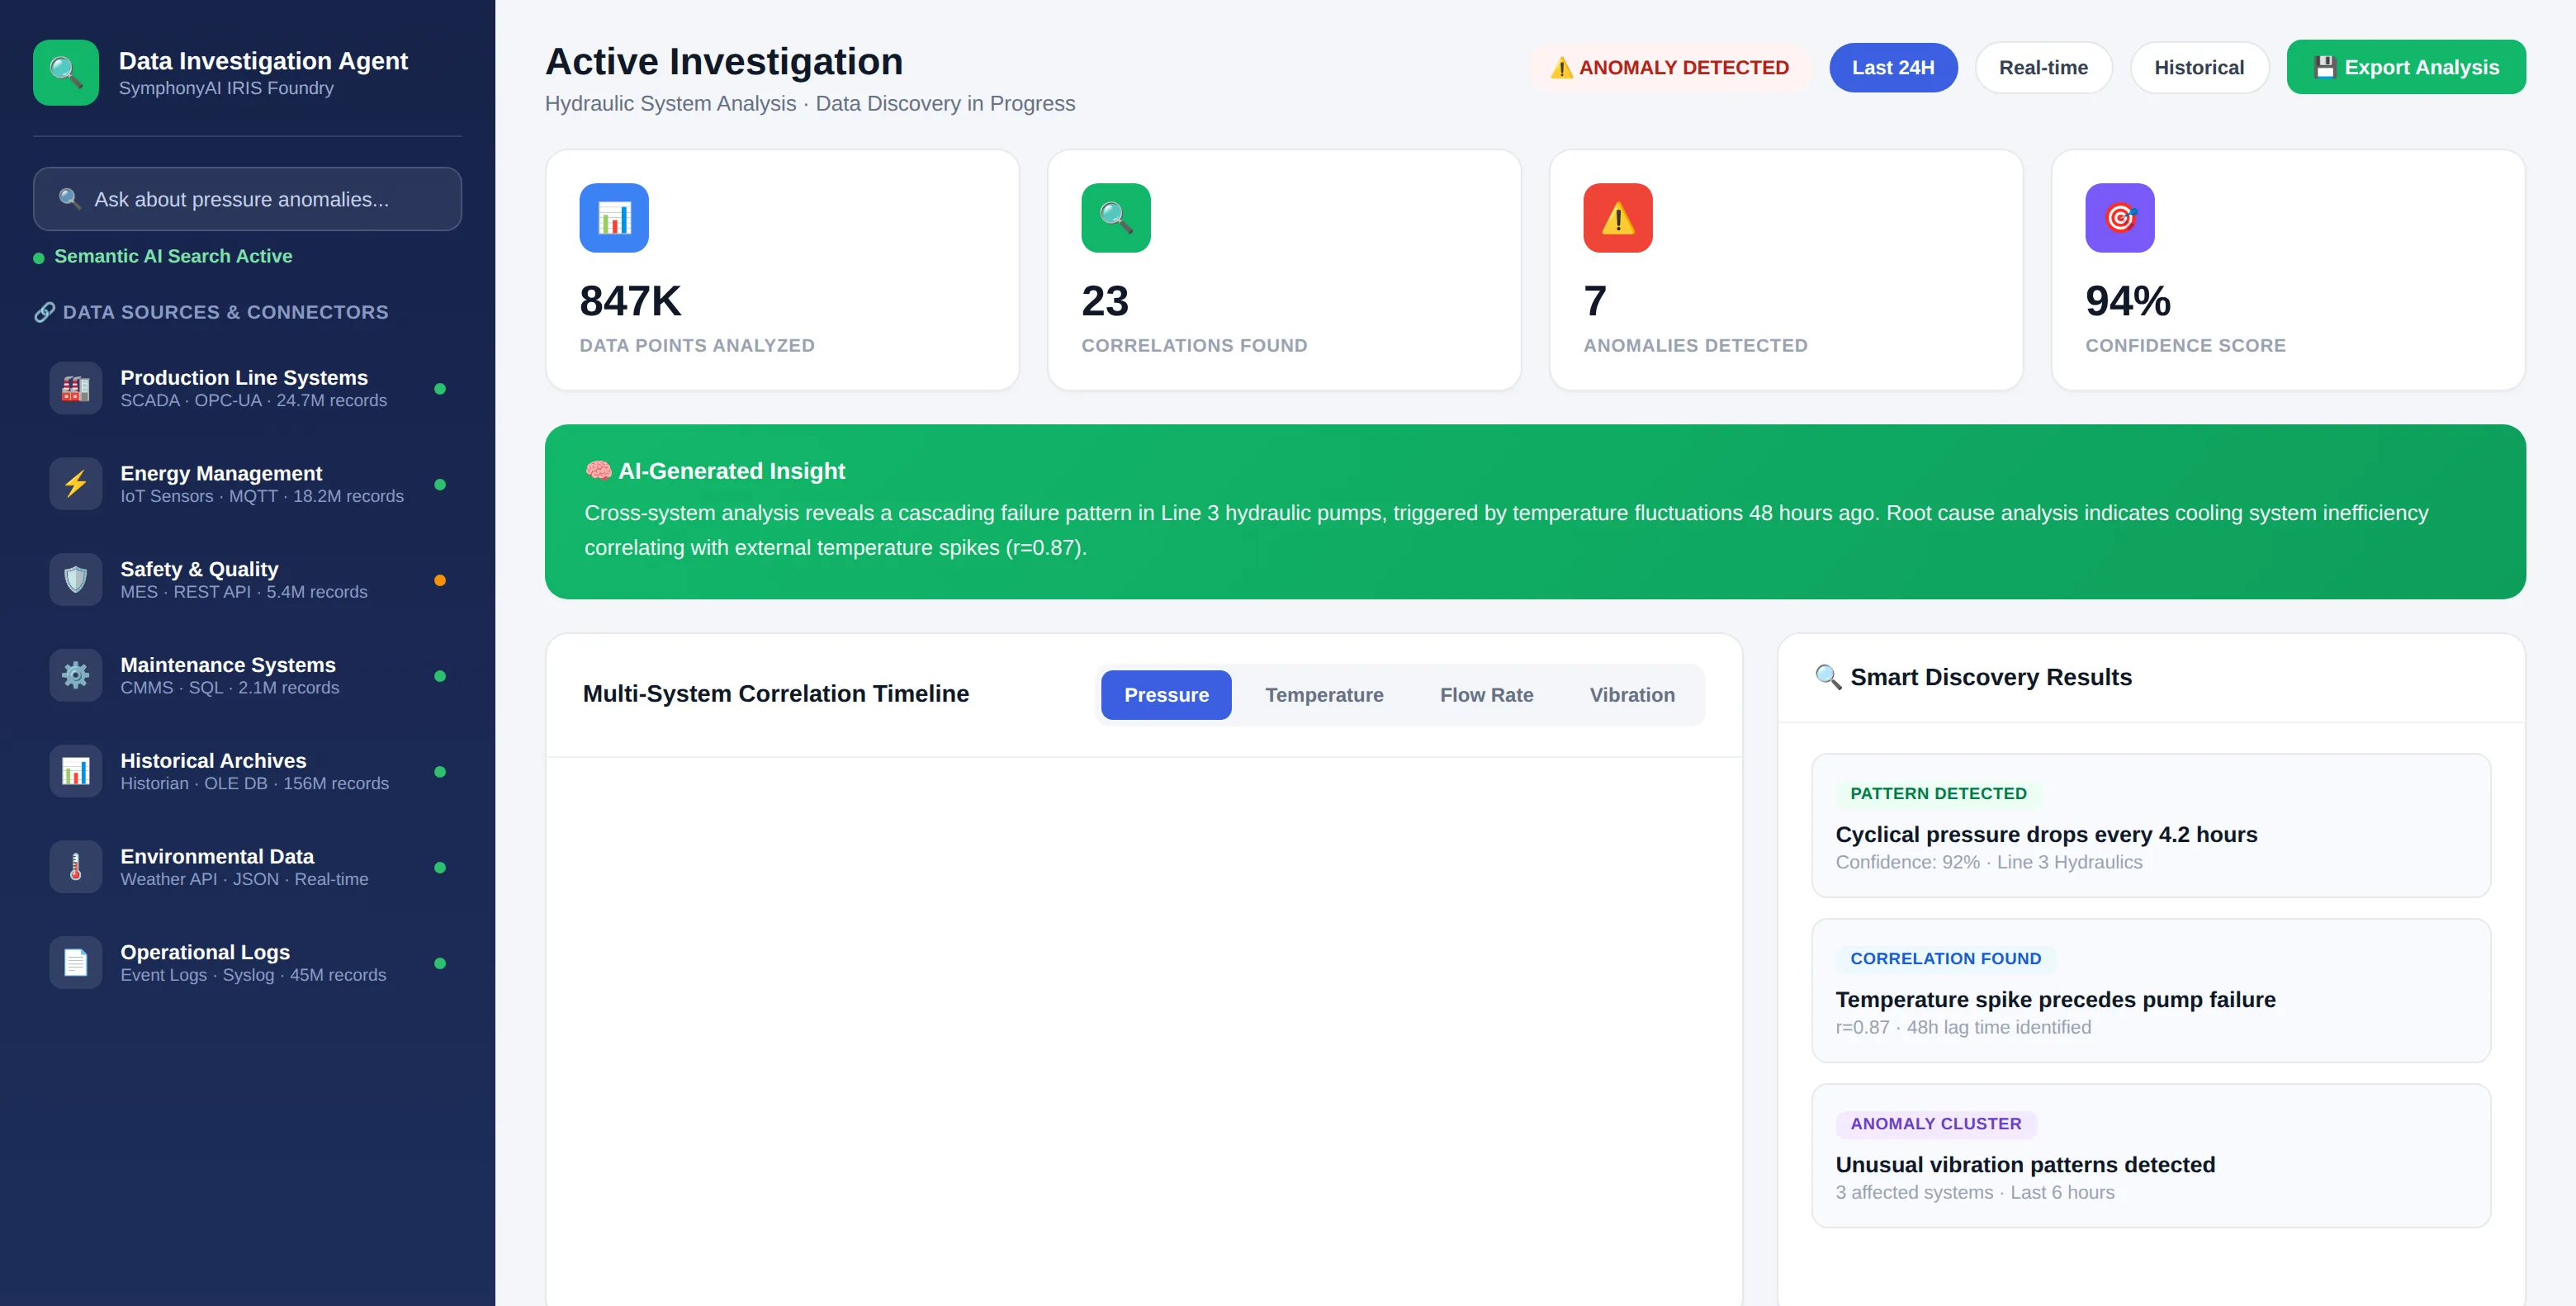
Industrial Data Exploration and Investigation Agent
Discrete Manufacturing
Energy
Metals and Mining
Oil and Gas
Utilities
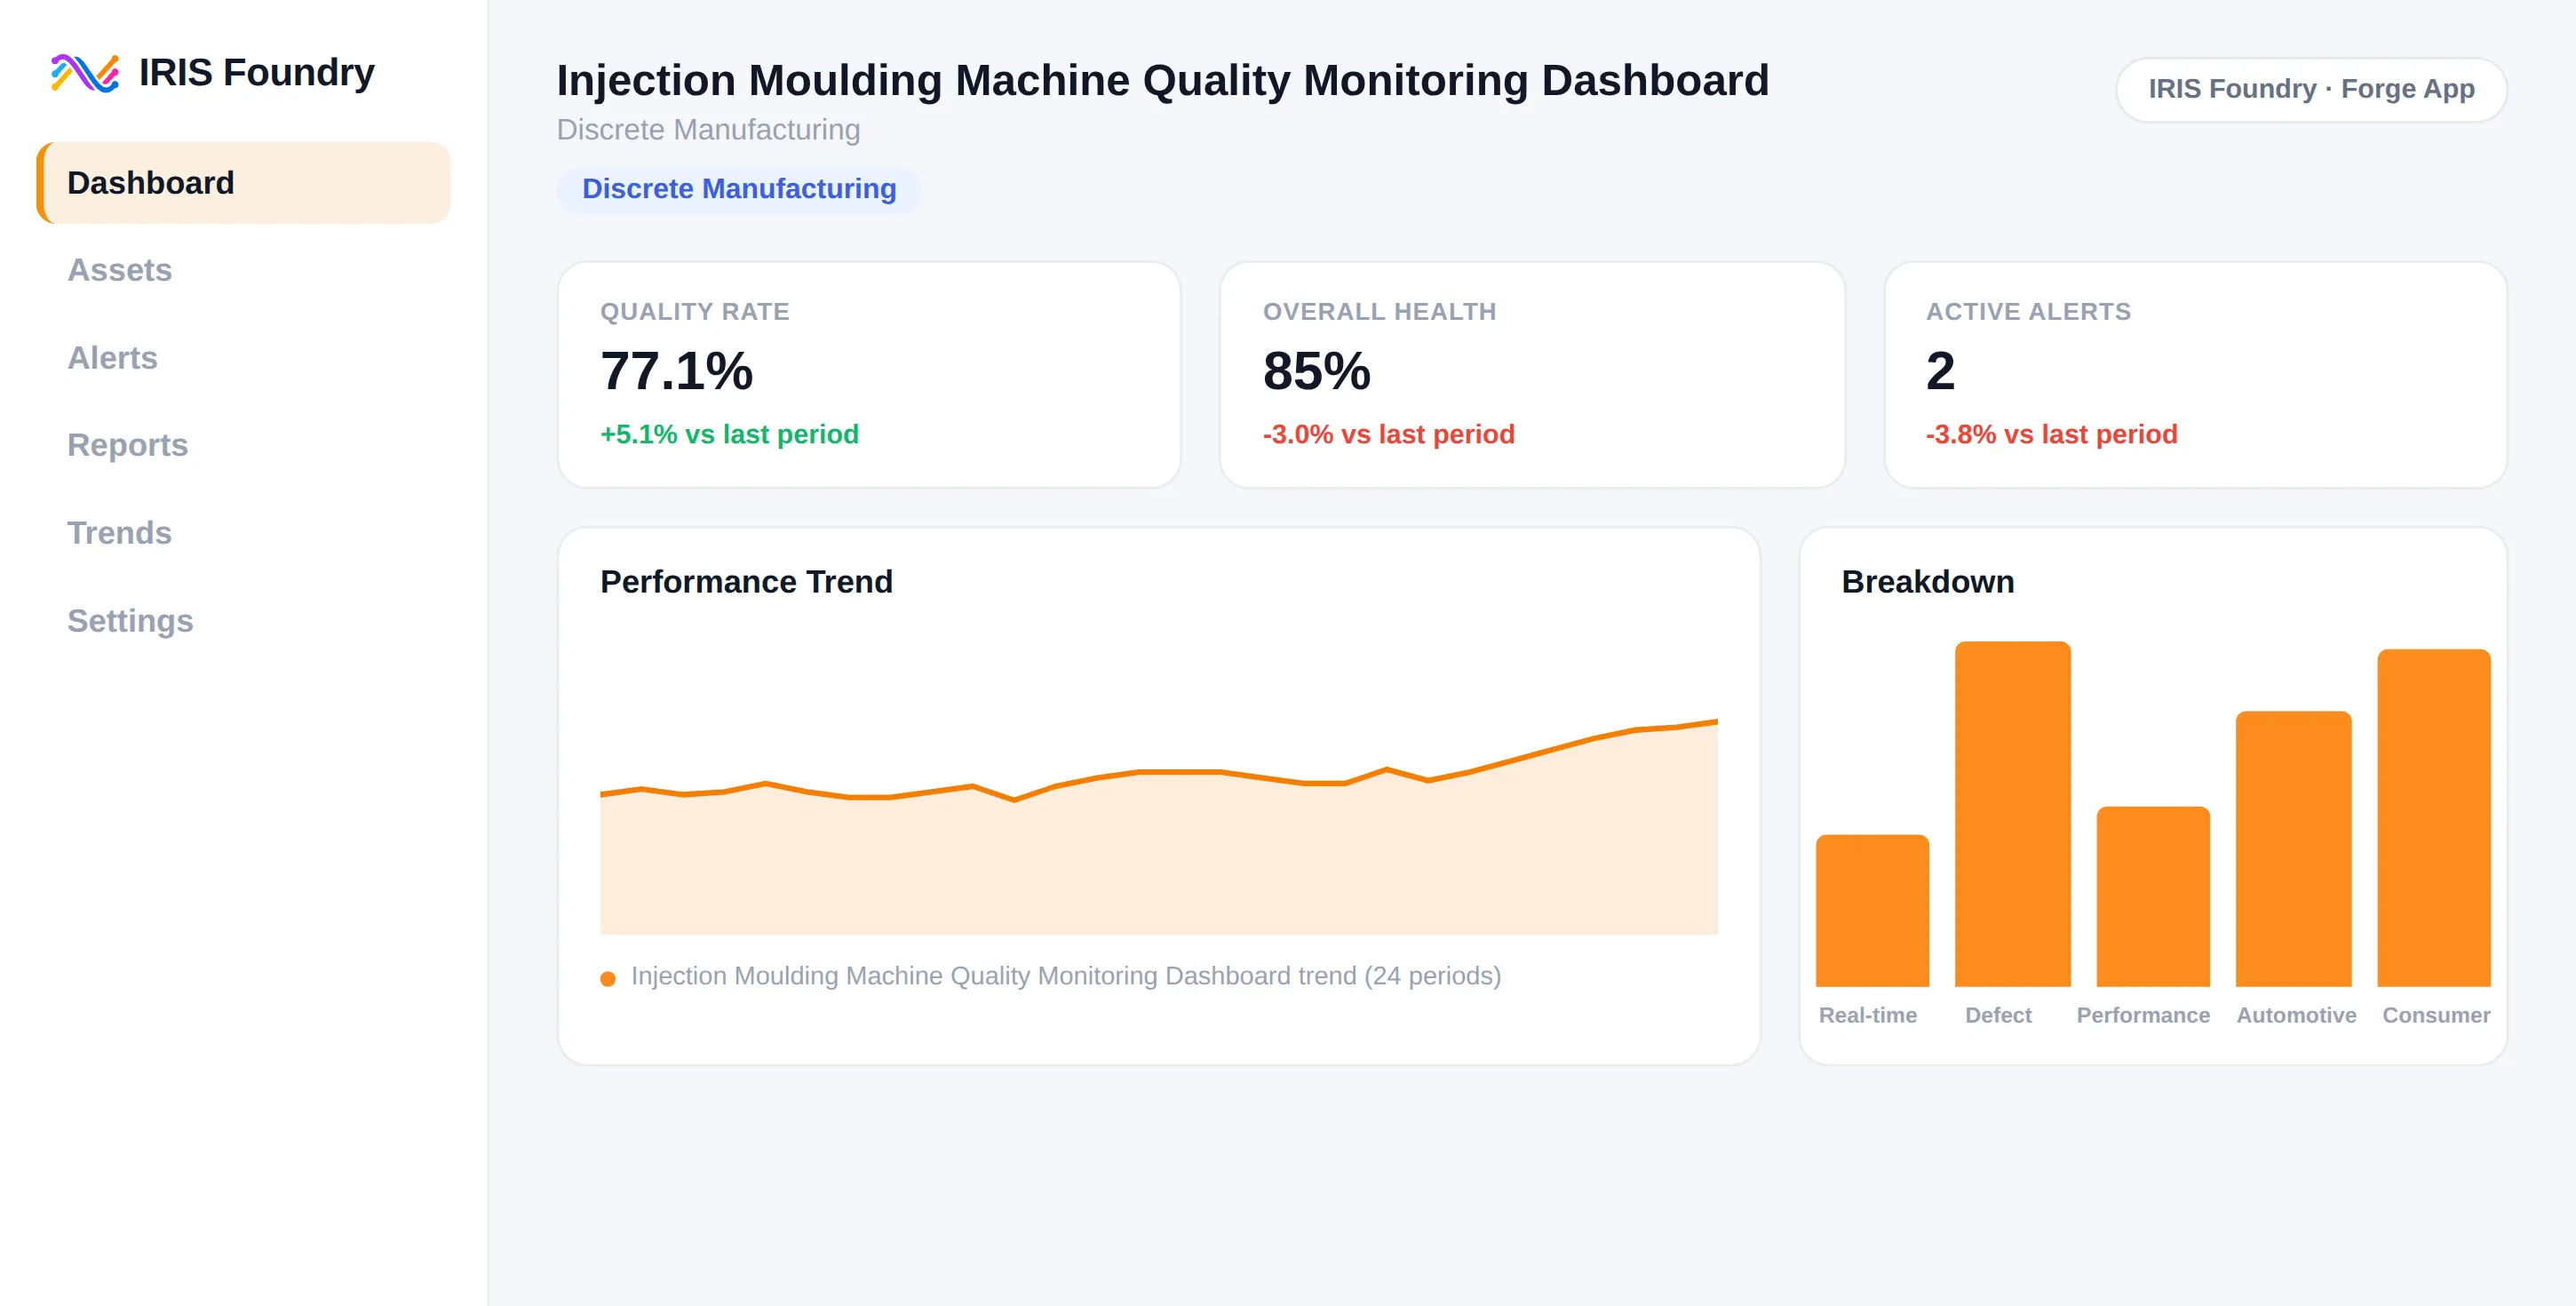
Injection Molding Machine Quality Monitoring Dashboard
Discrete Manufacturing
CPG
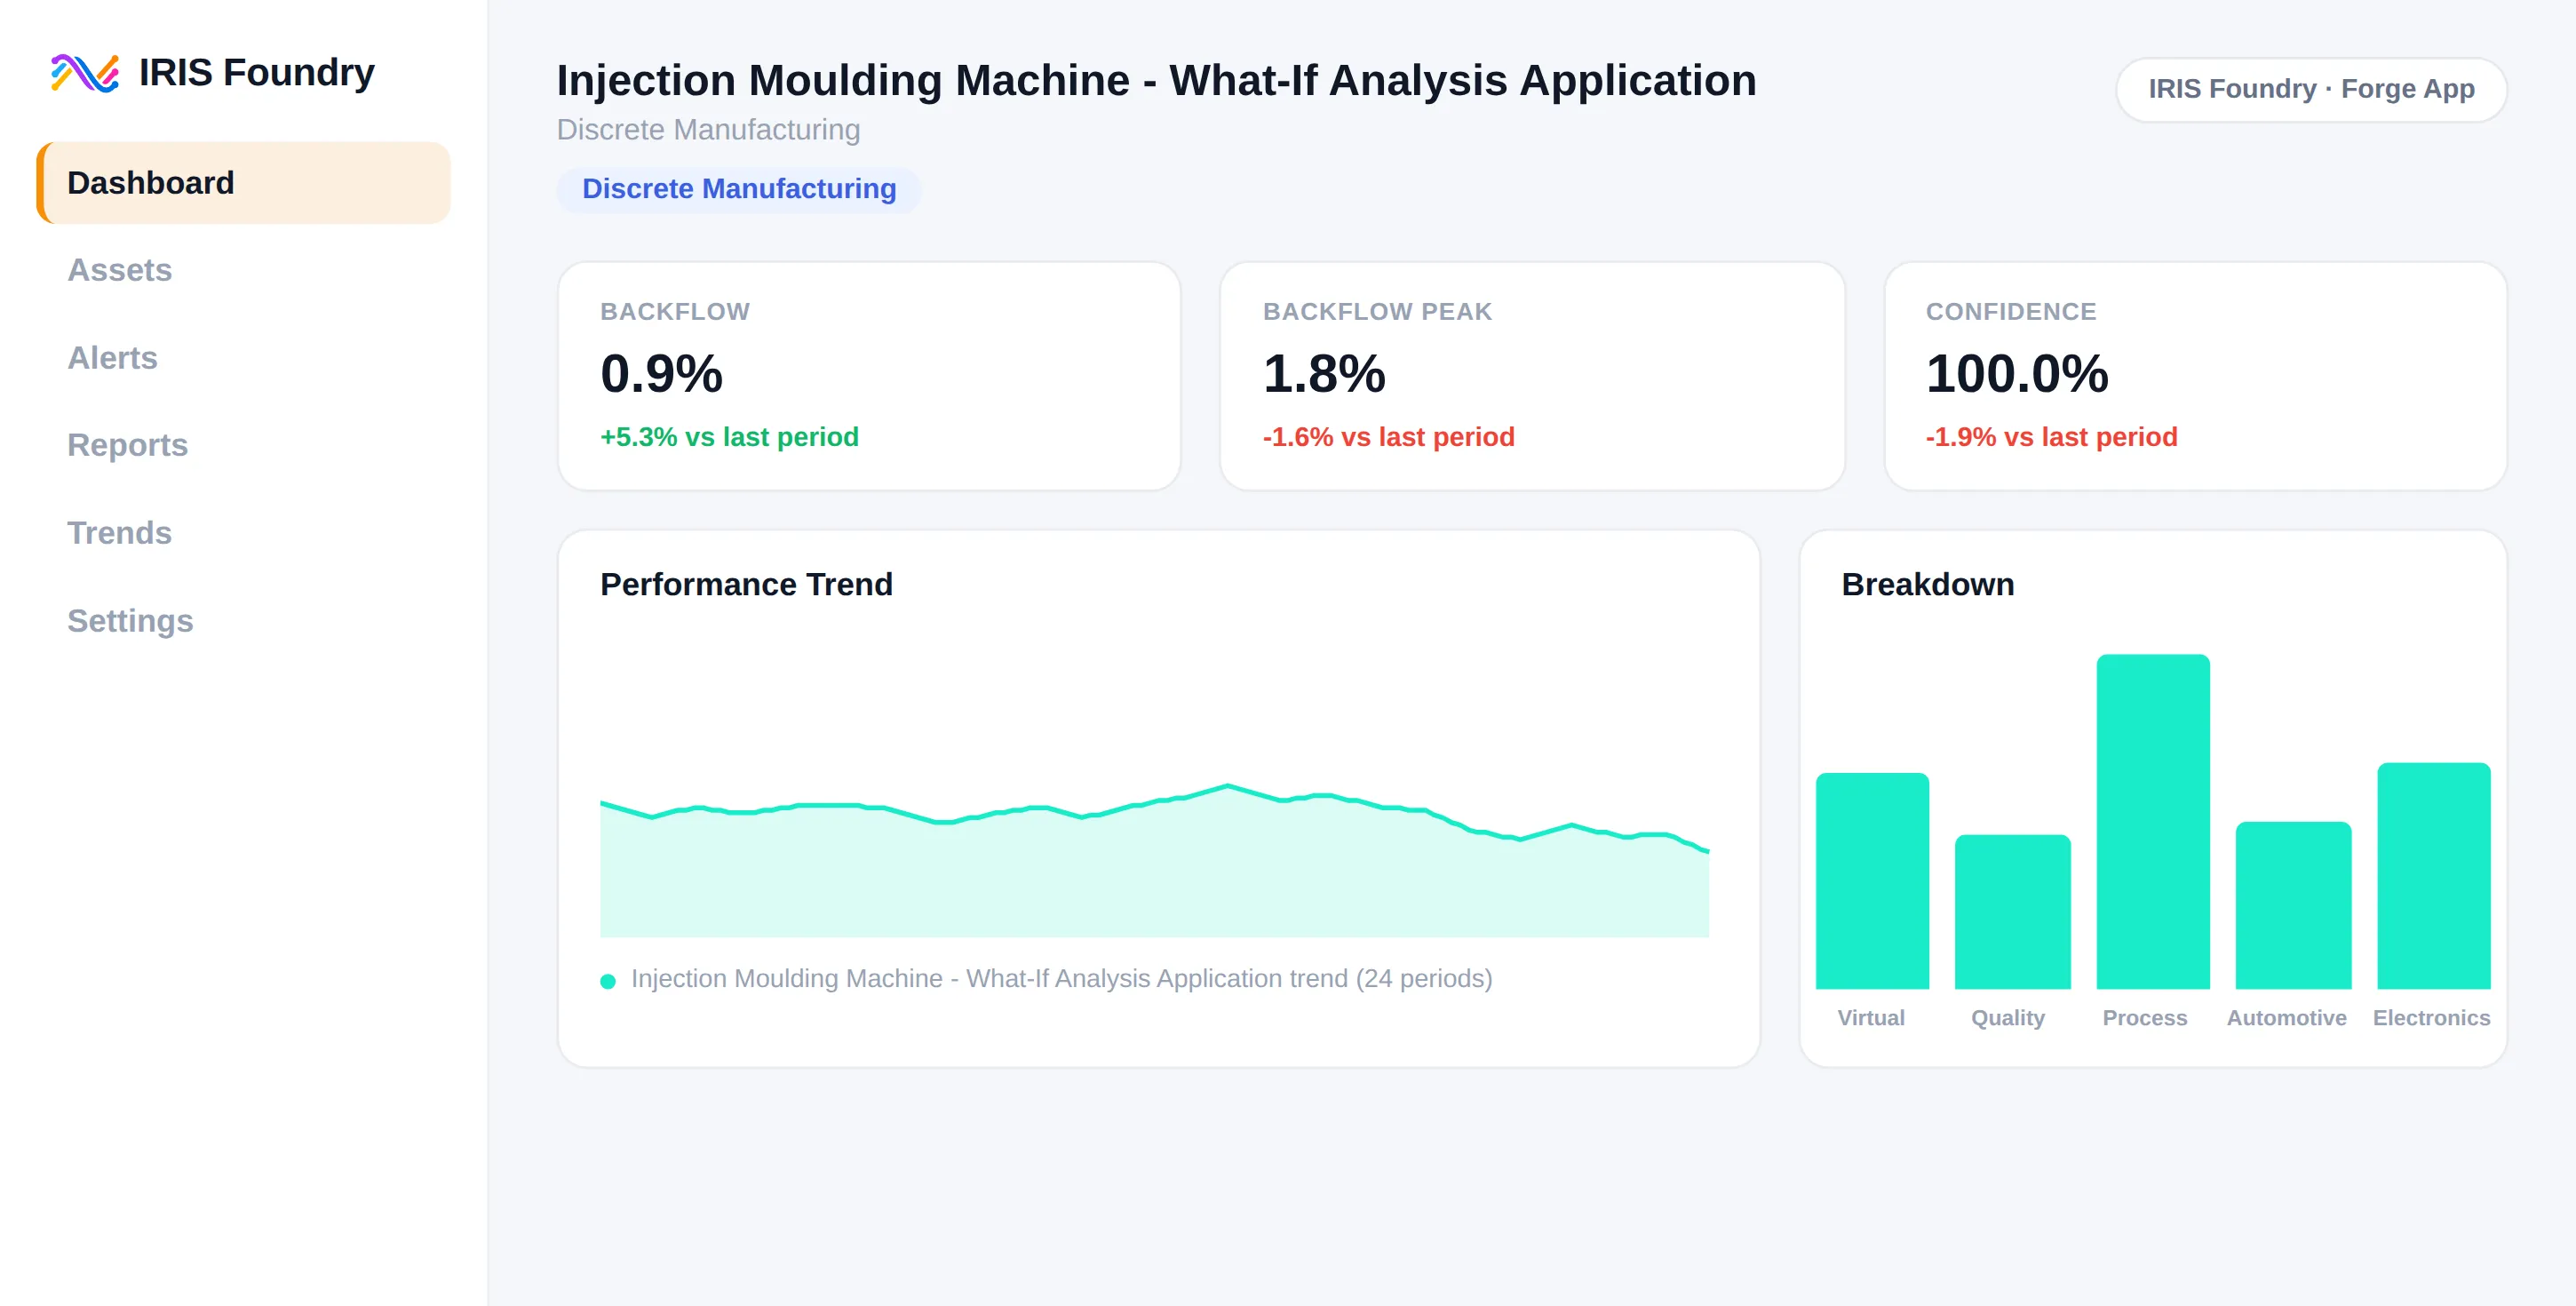
Injection Molding Machine What-If Analysis Application
Discrete Manufacturing
CPG
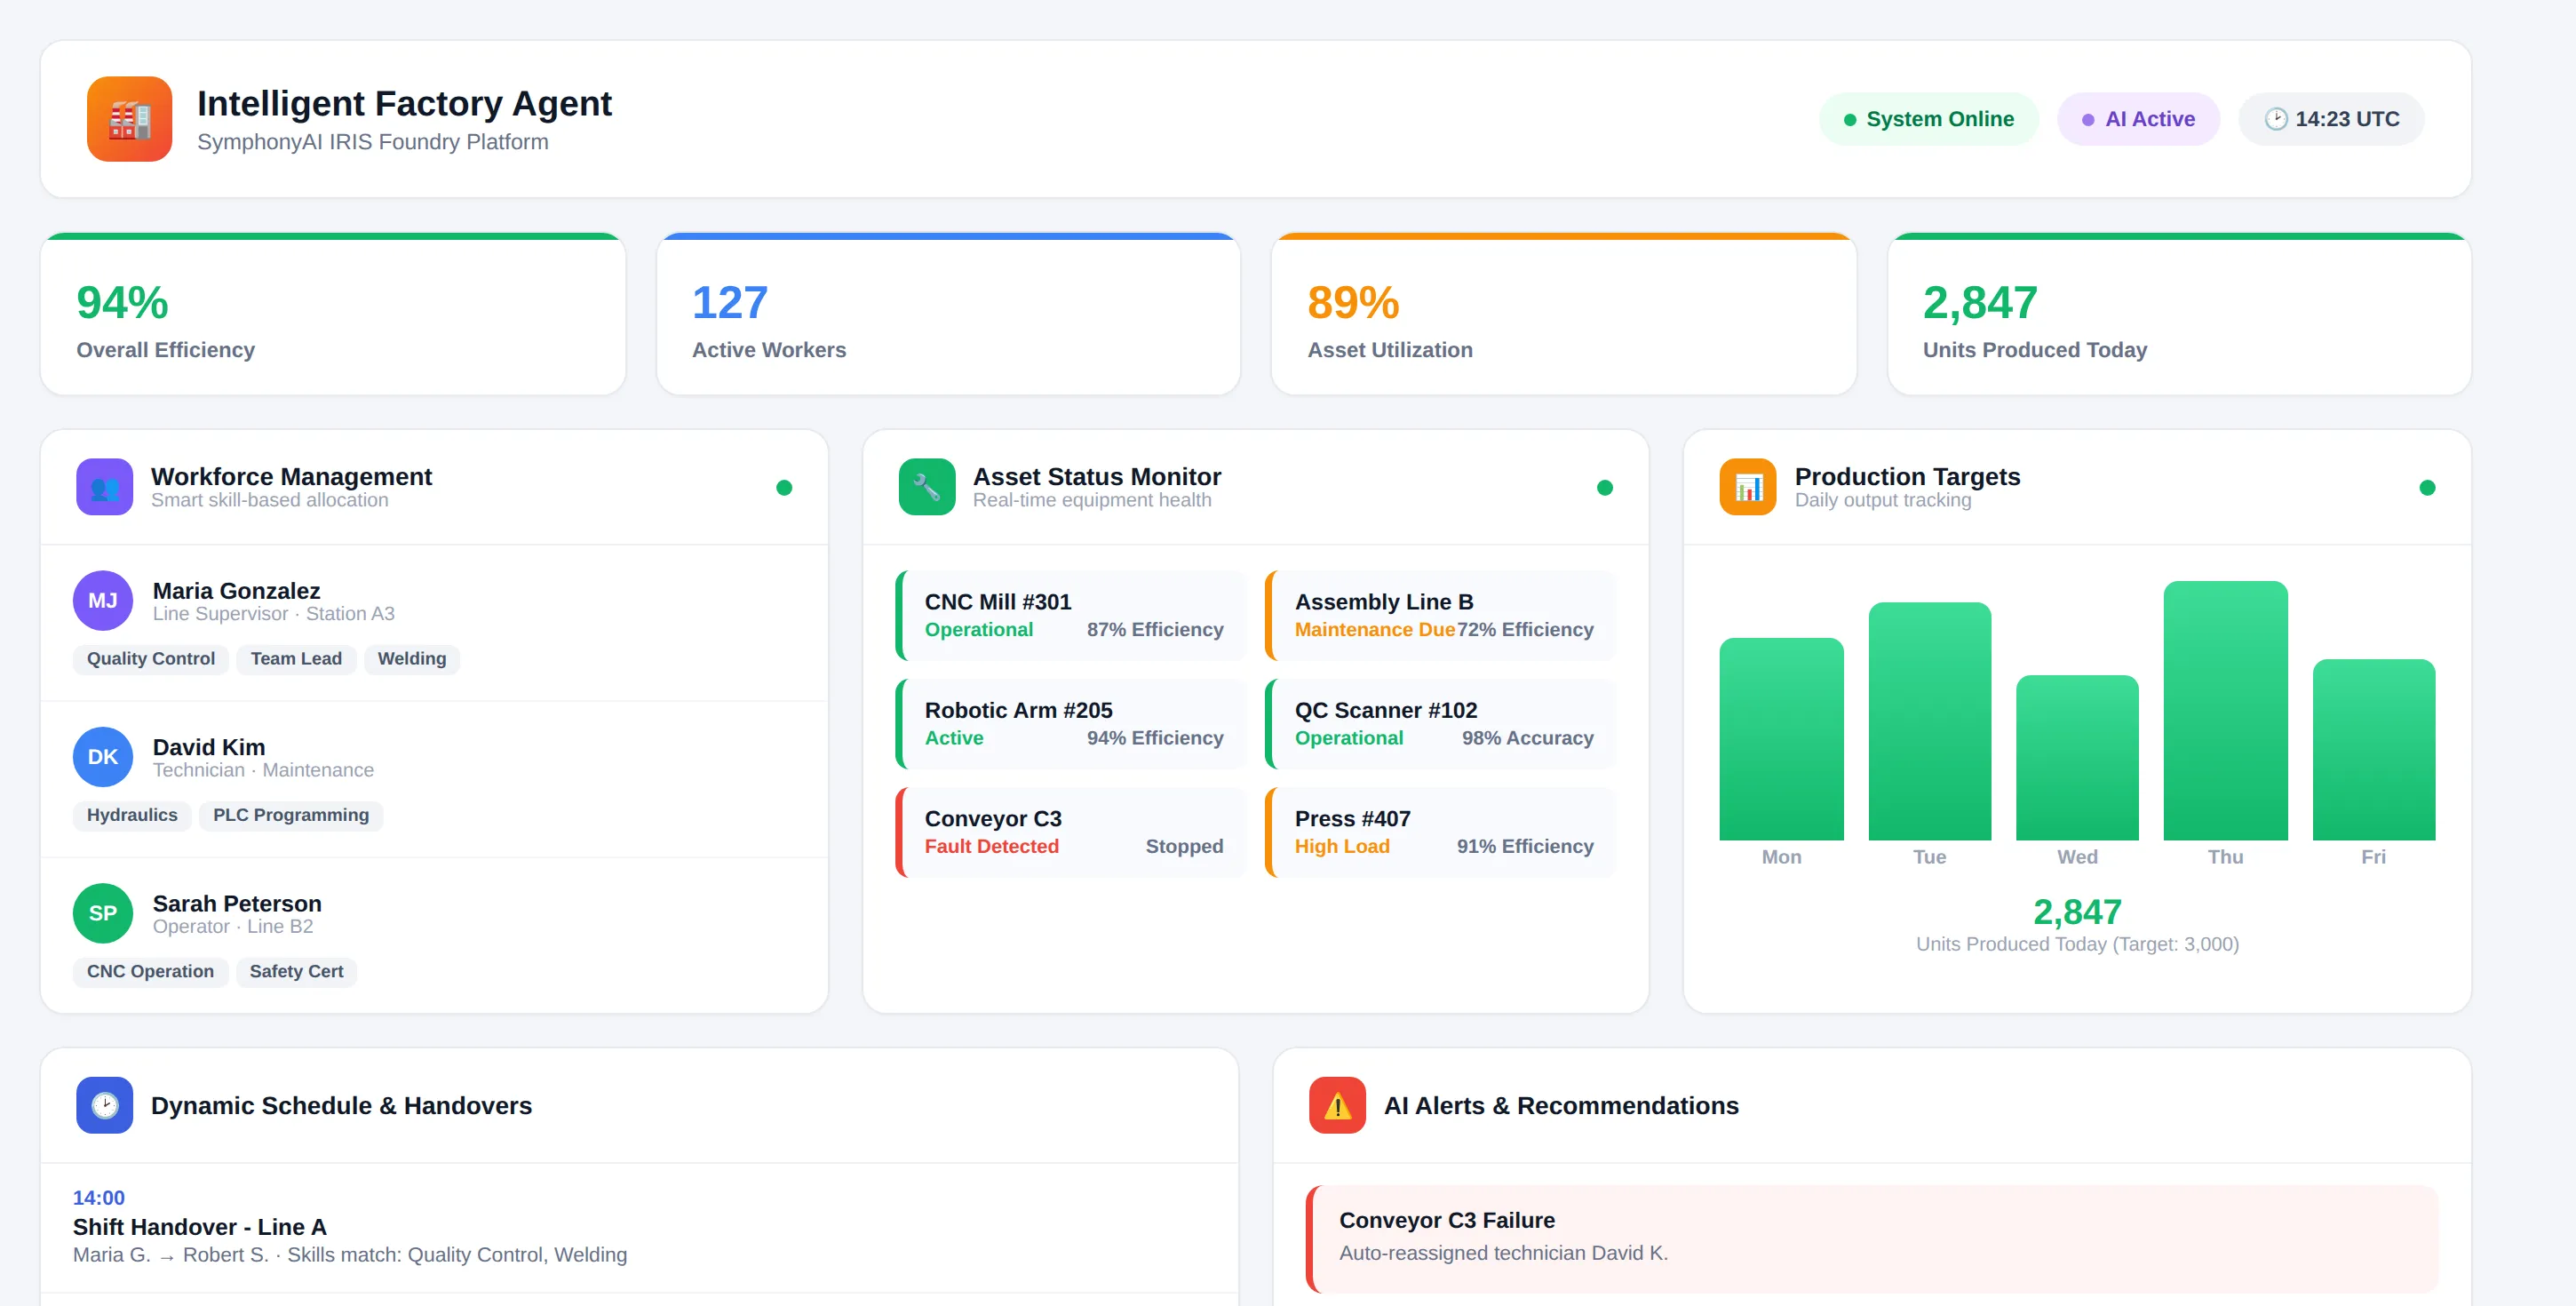
Intelligent Factory Agent
Discrete Manufacturing
CPG
Food and Beverage
Chemical
Pharmaceuticals and Life Sciences
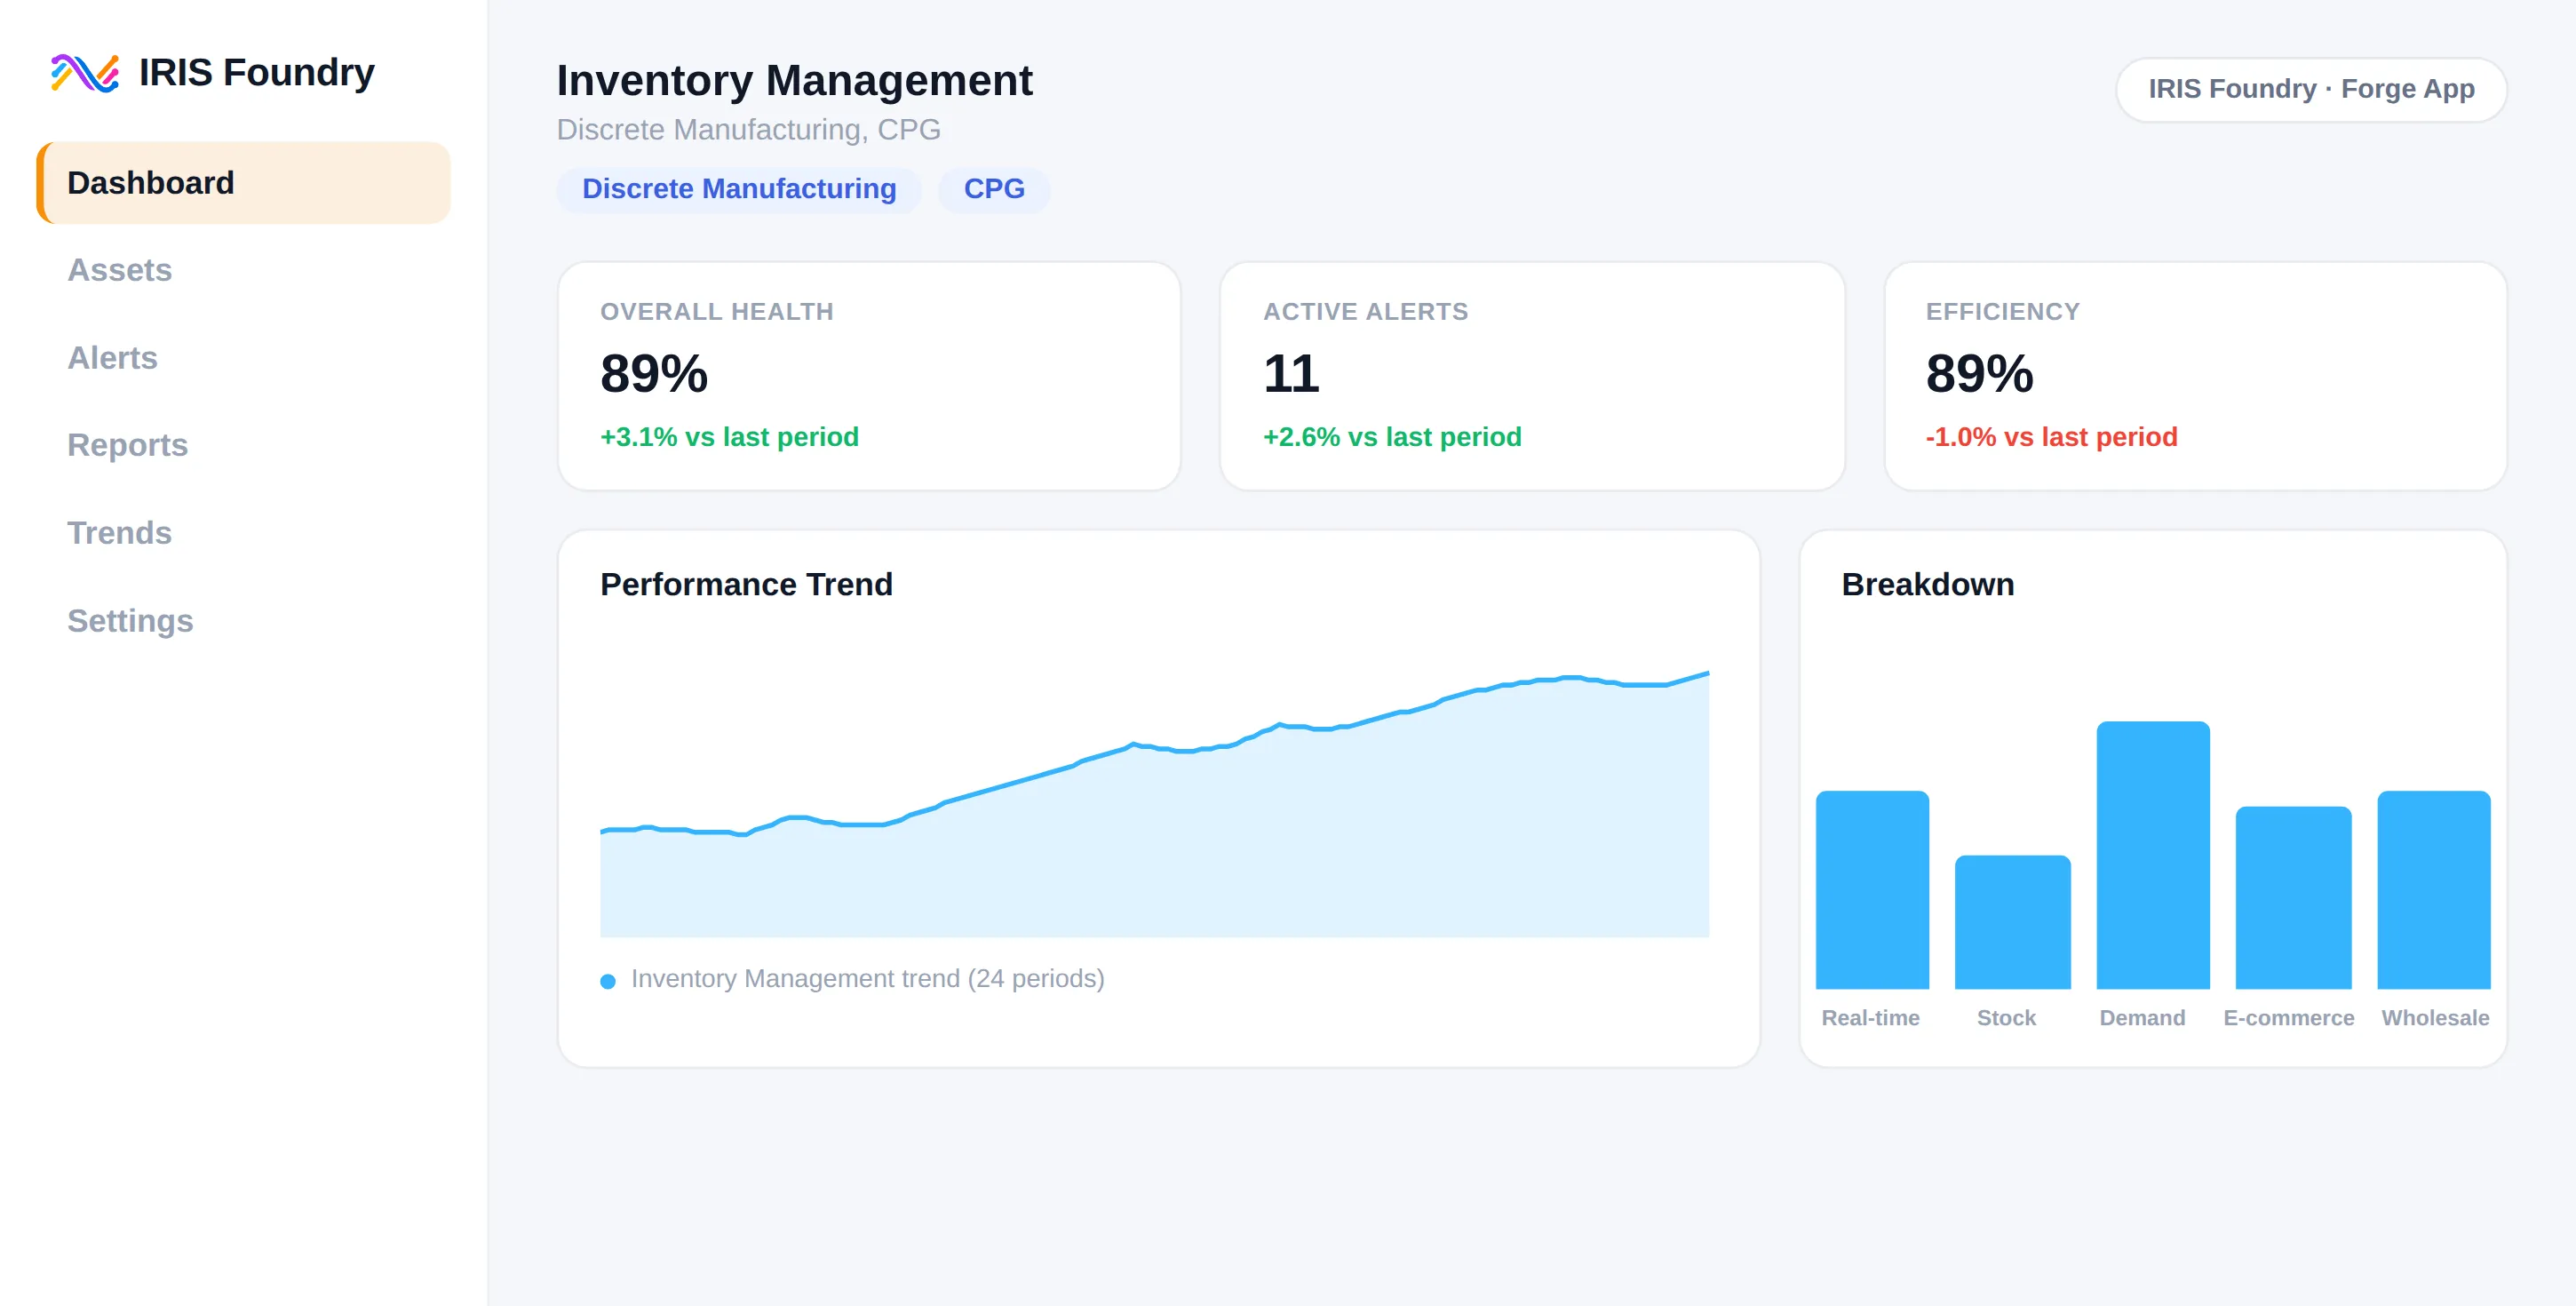
Inventory Management
Metals and Mining
Discrete Manufacturing
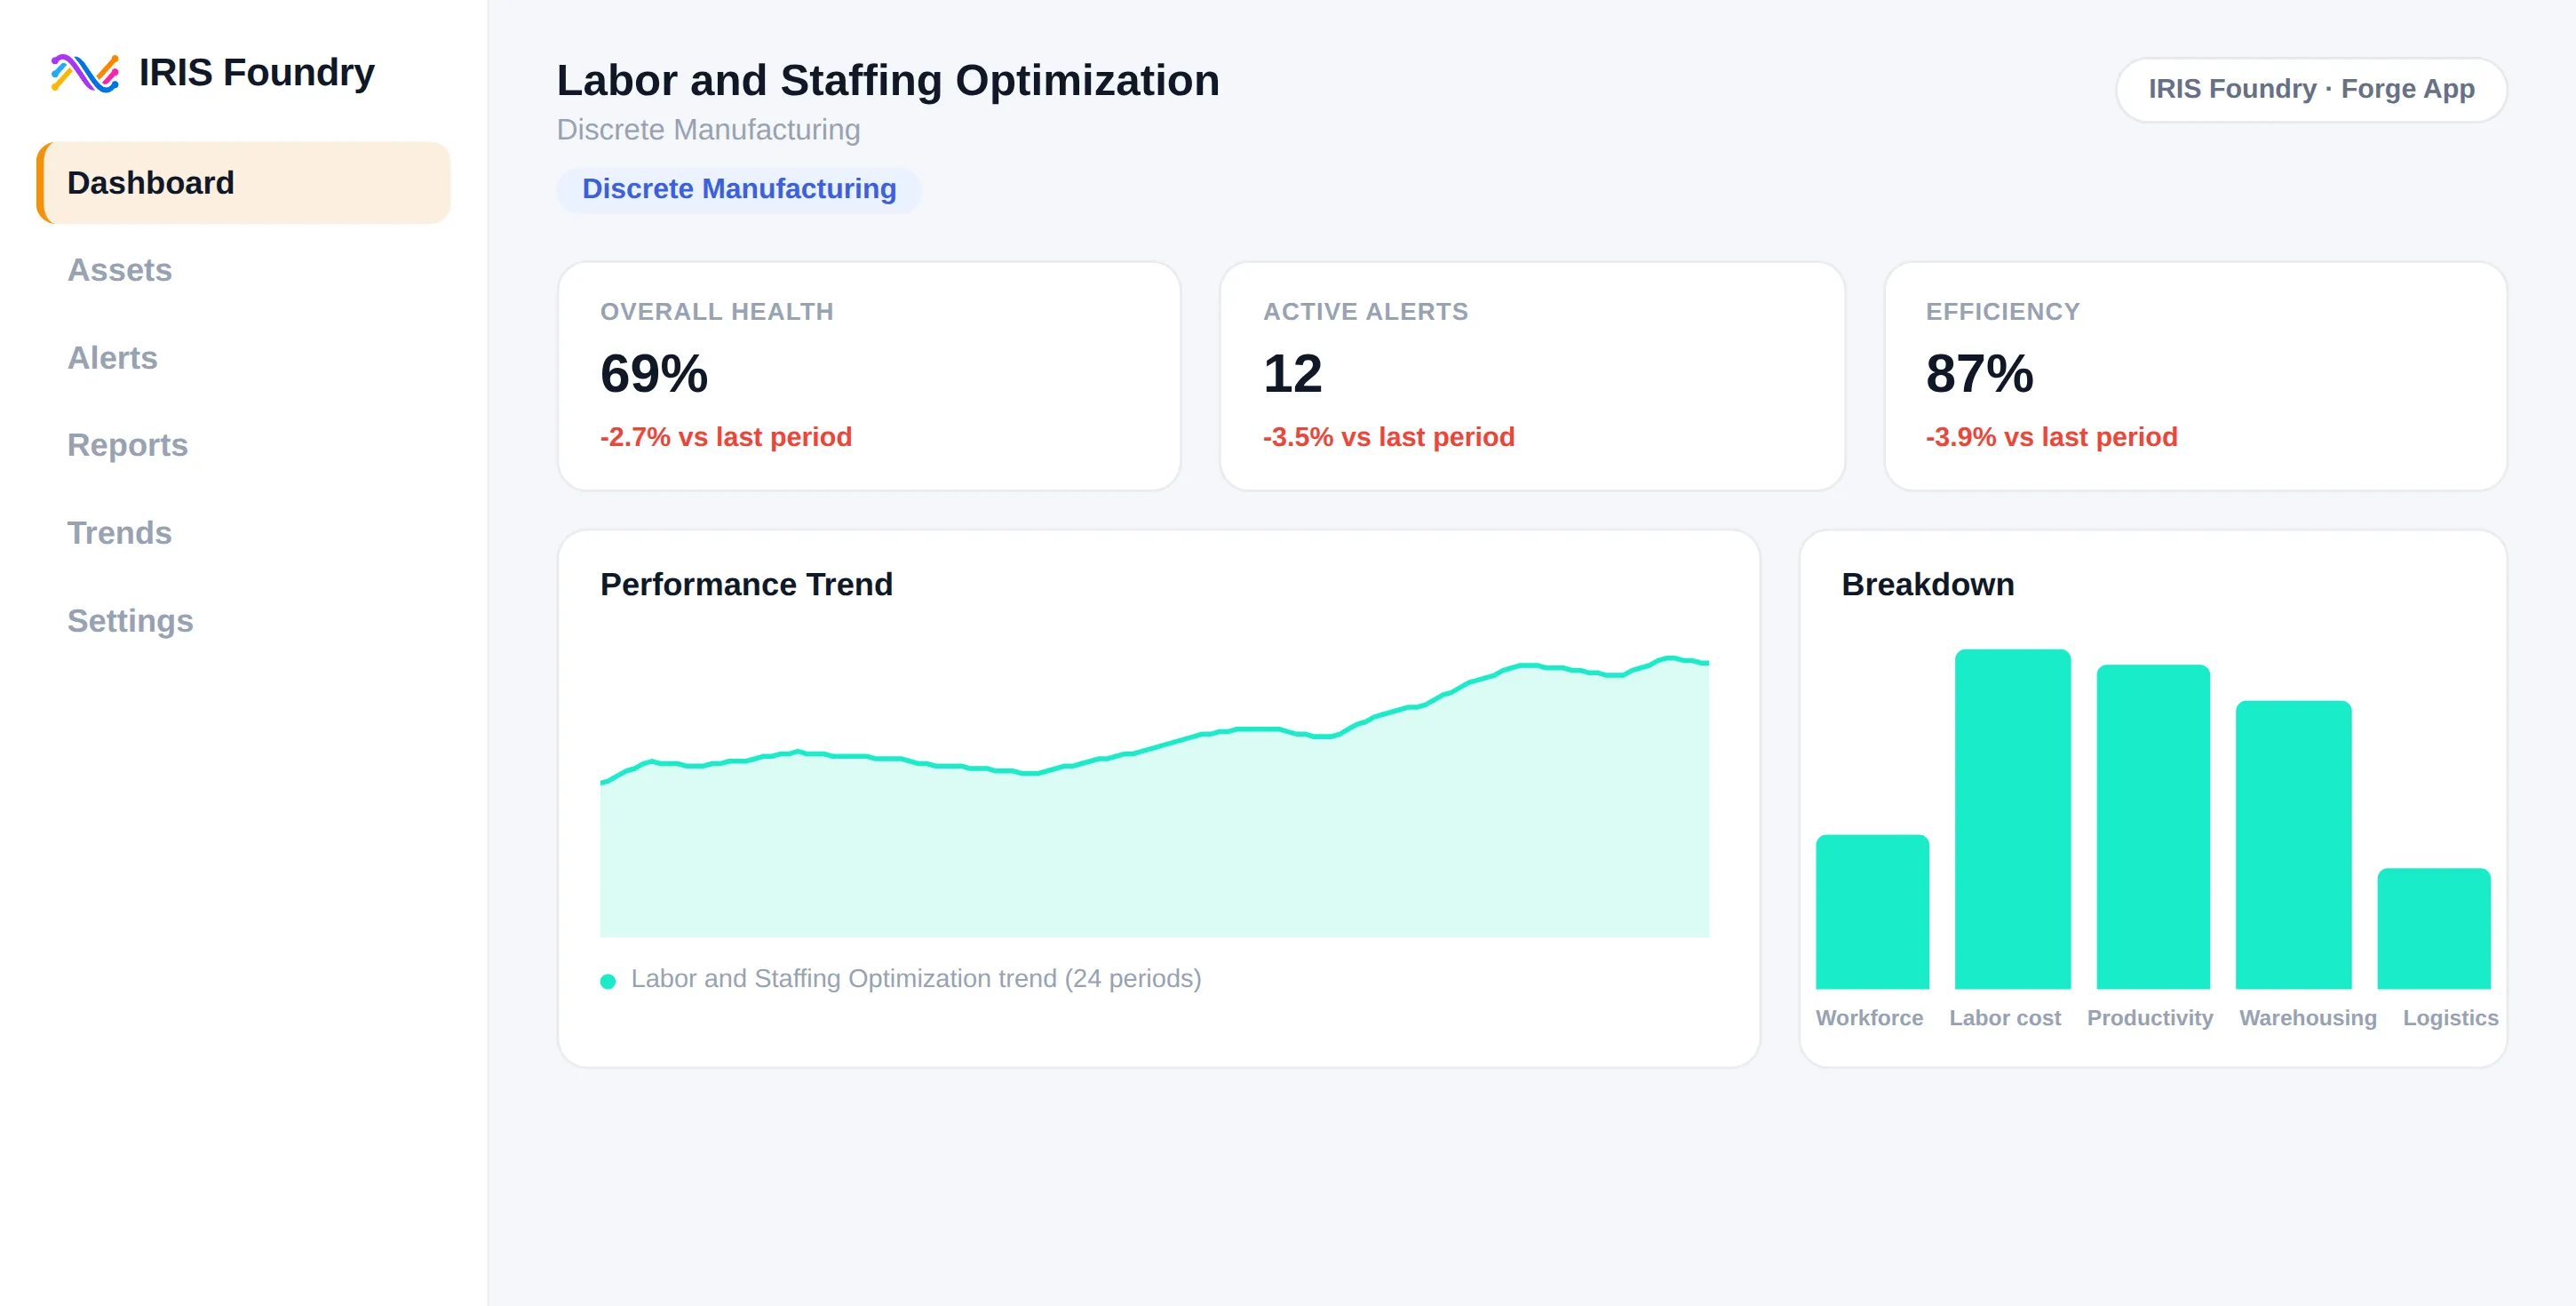
Labor and Staffing Optimization
Discrete Manufacturing
CPG
Food and Beverage
Chemical
Pharmaceuticals and Life Sciences
Malt Beverage Production Operations
Food and Beverage
CPG
Manufacturing Digital Twin Agent
Discrete Manufacturing
Oil and Gas
Chemical
Utilities
Energy
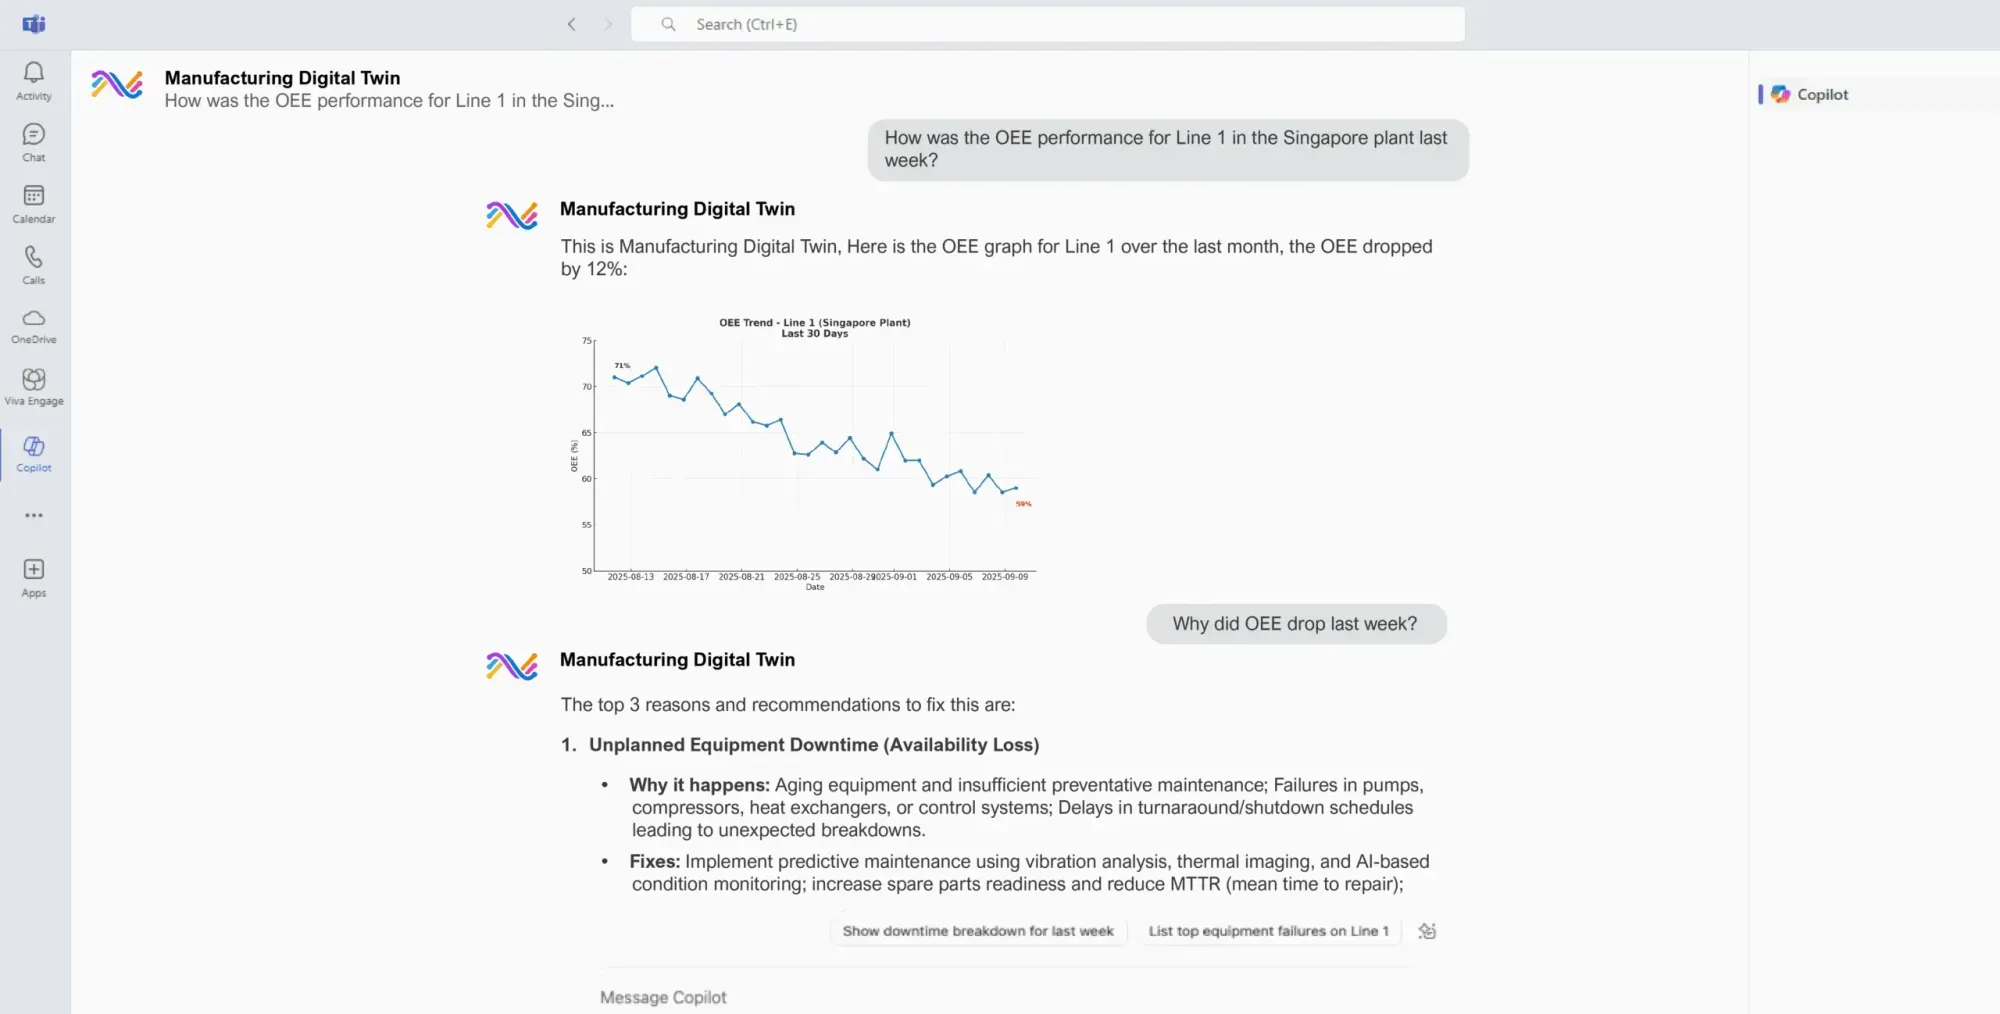
Manufacturing Digital Twin Agent for Teams and M365 Copilot
Discrete Manufacturing
Chemical
CPG
Energy
Food and Beverage
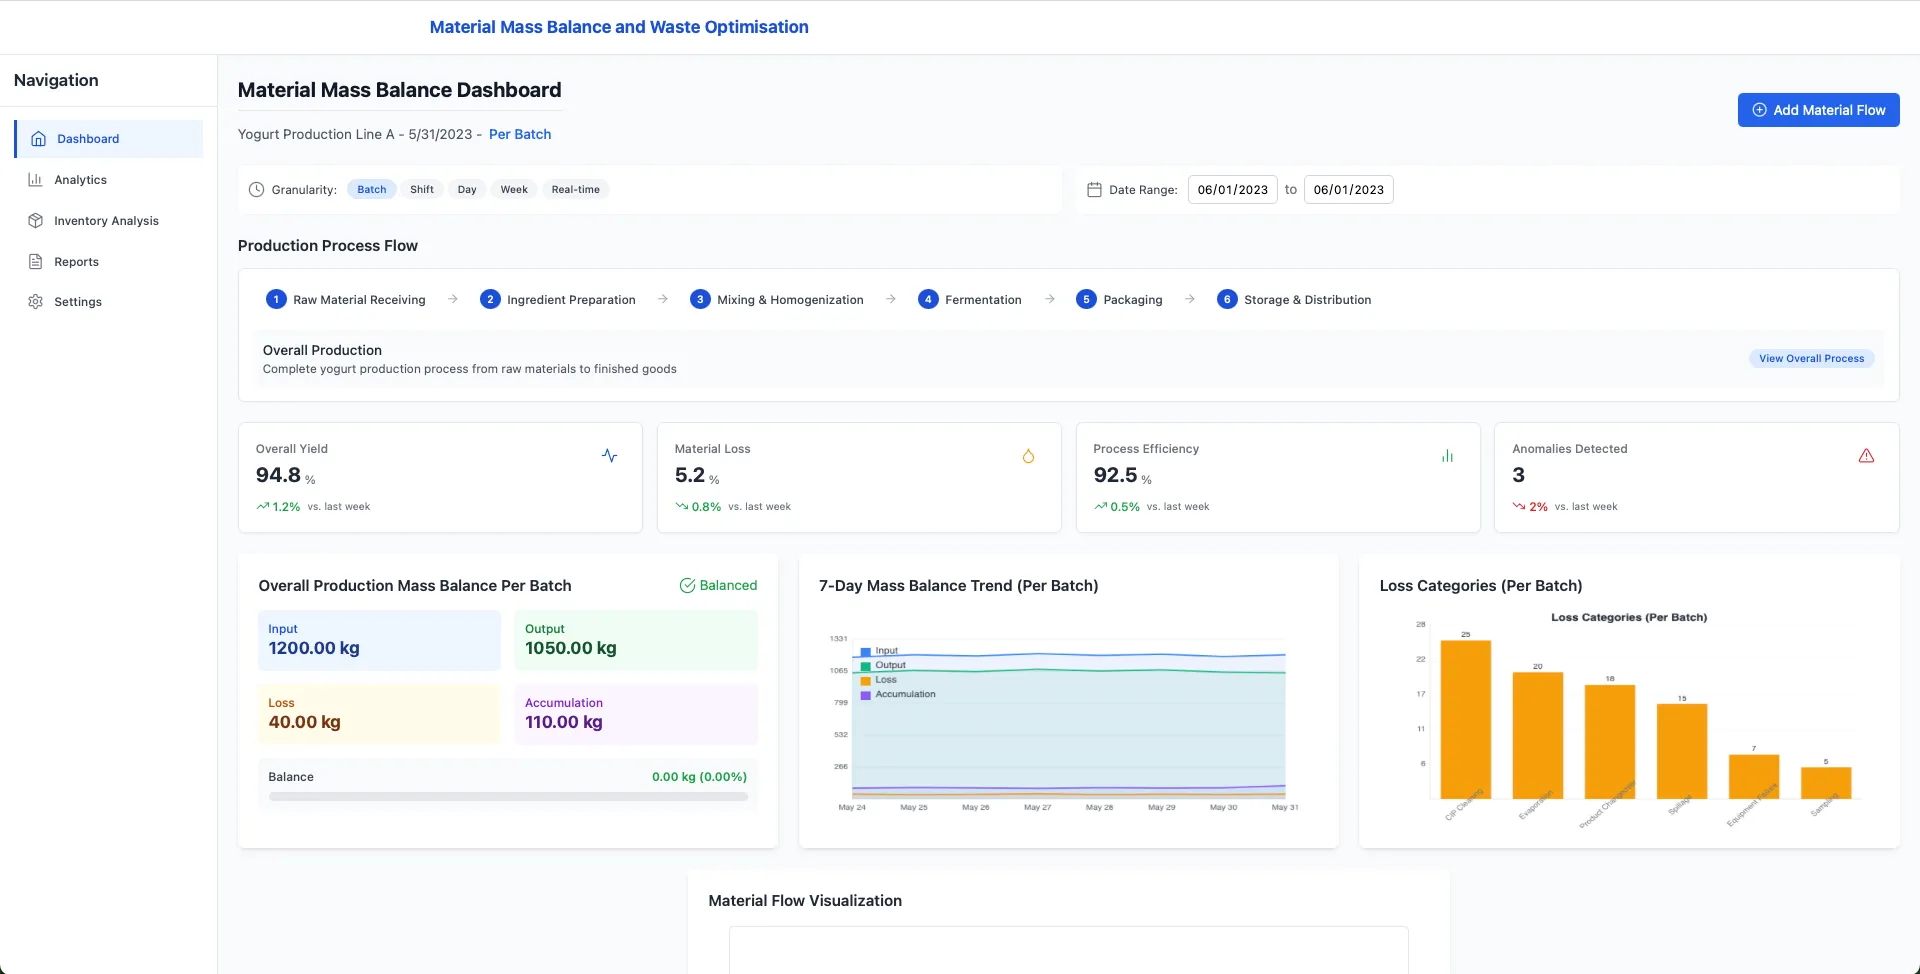
Material Mass Balance
Chemical
Food and Beverage
Pharmaceuticals and Life Sciences
CPG
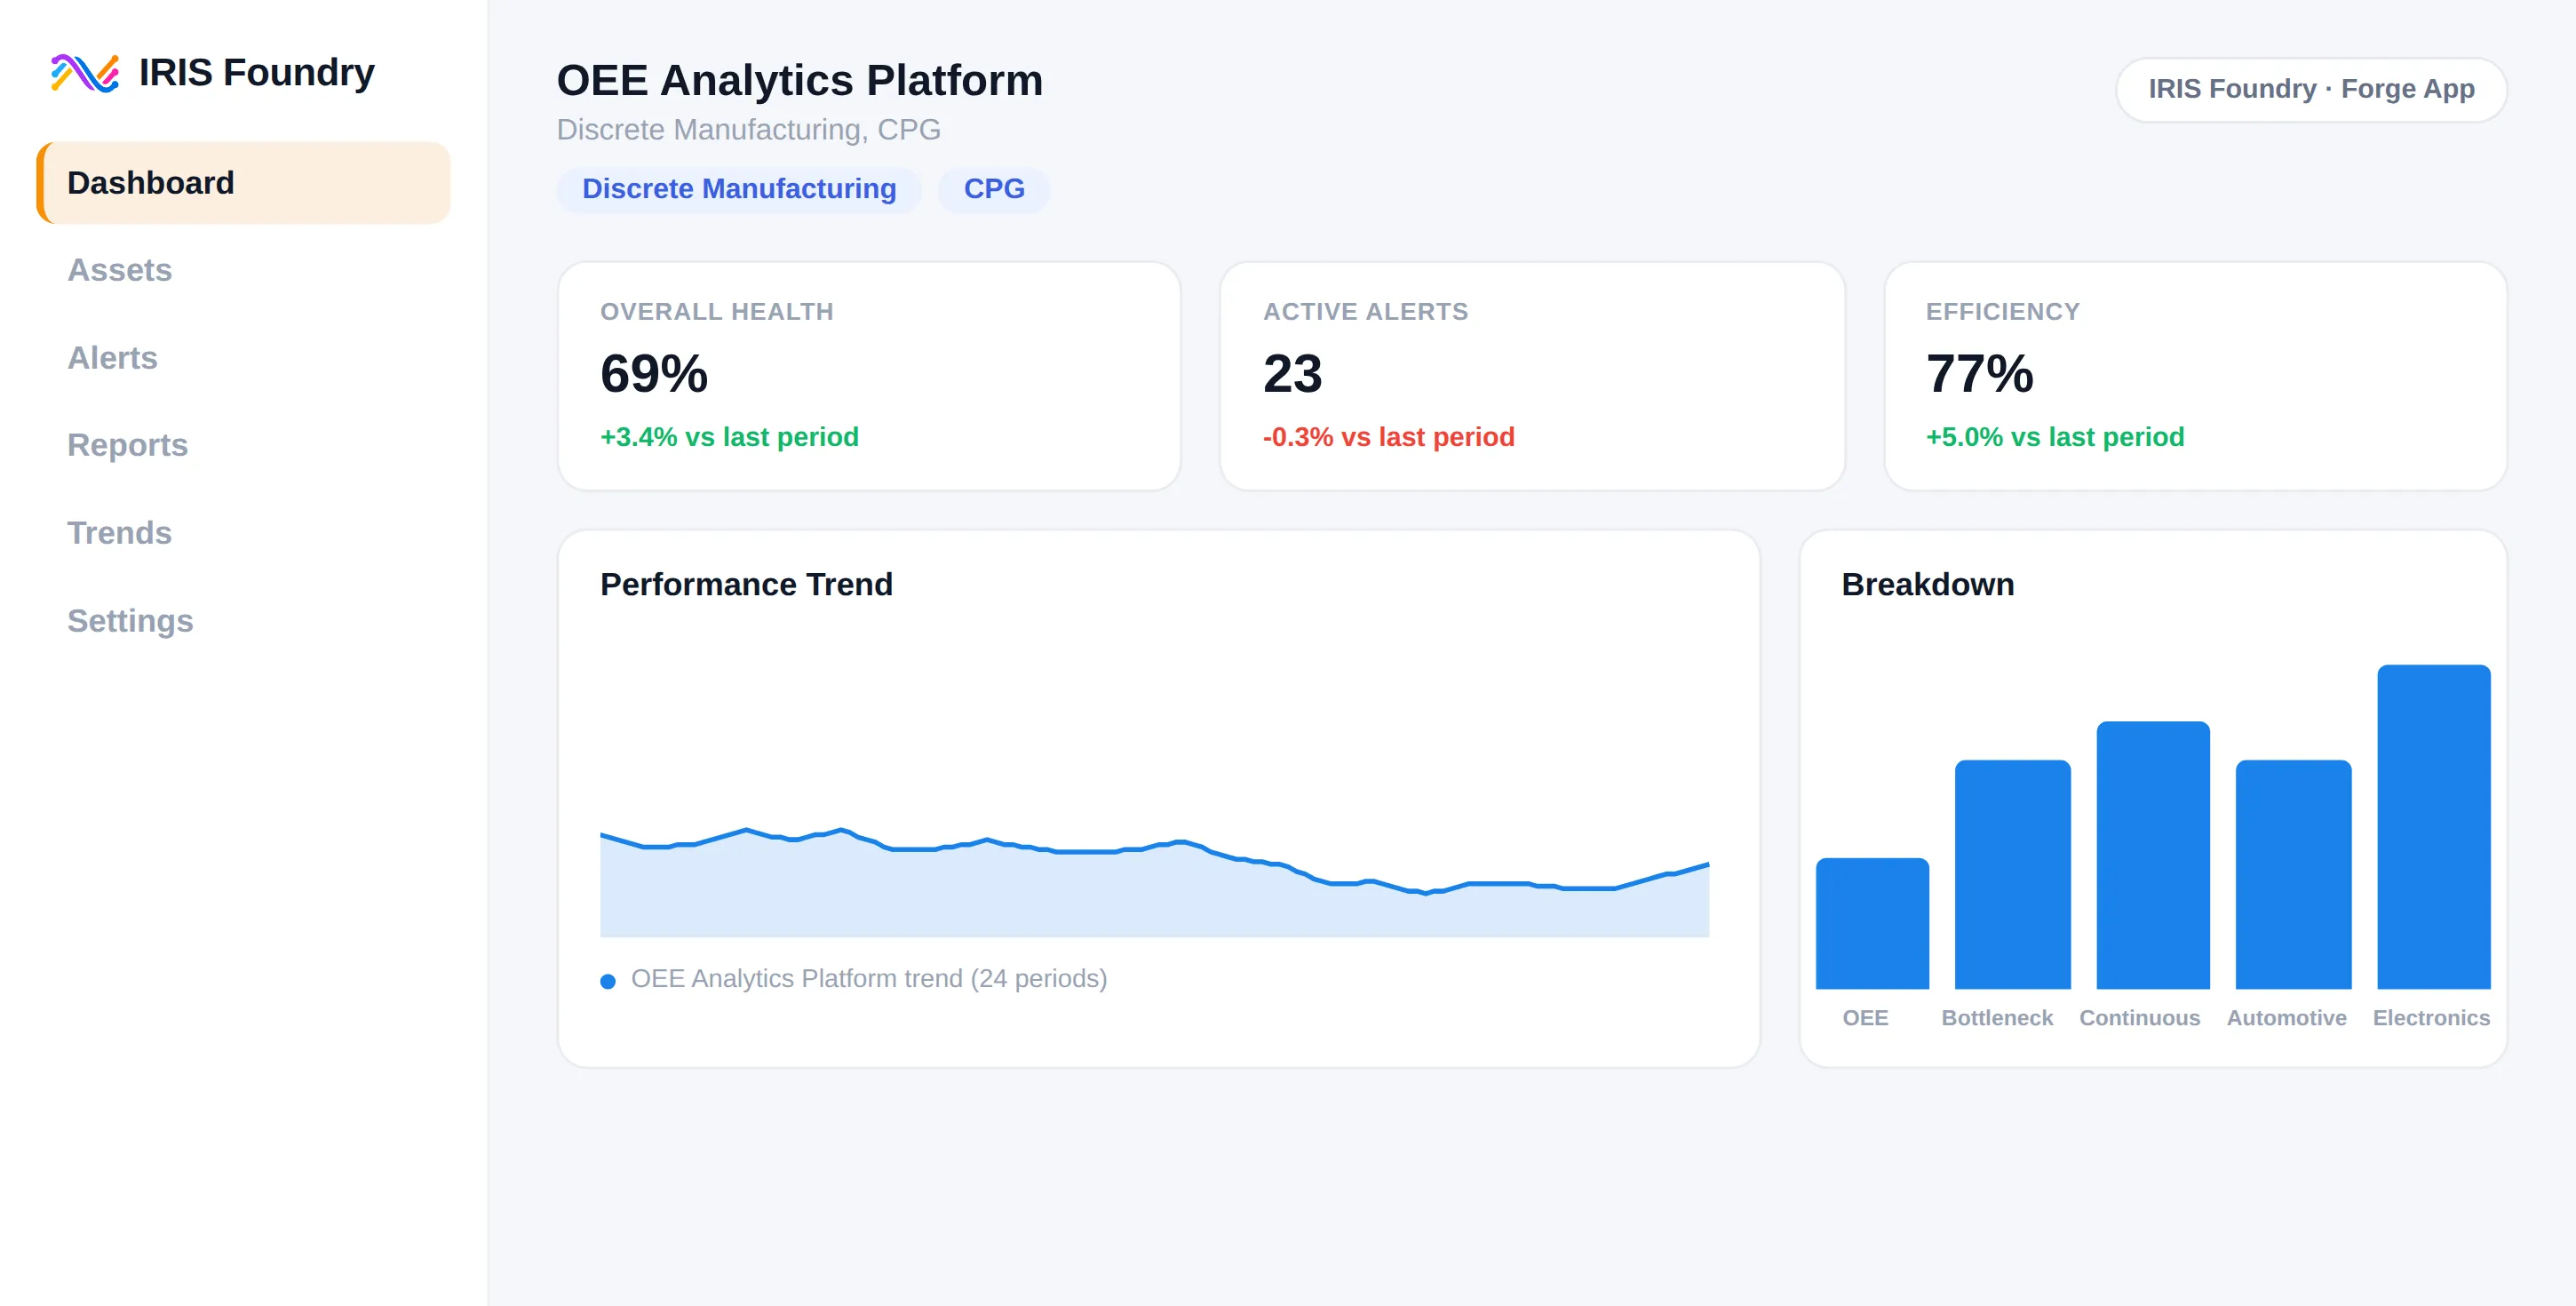
OEE Analytics Platform
Discrete Manufacturing
CPG
Food and Beverage
Chemical
Pharmaceuticals and Life Sciences
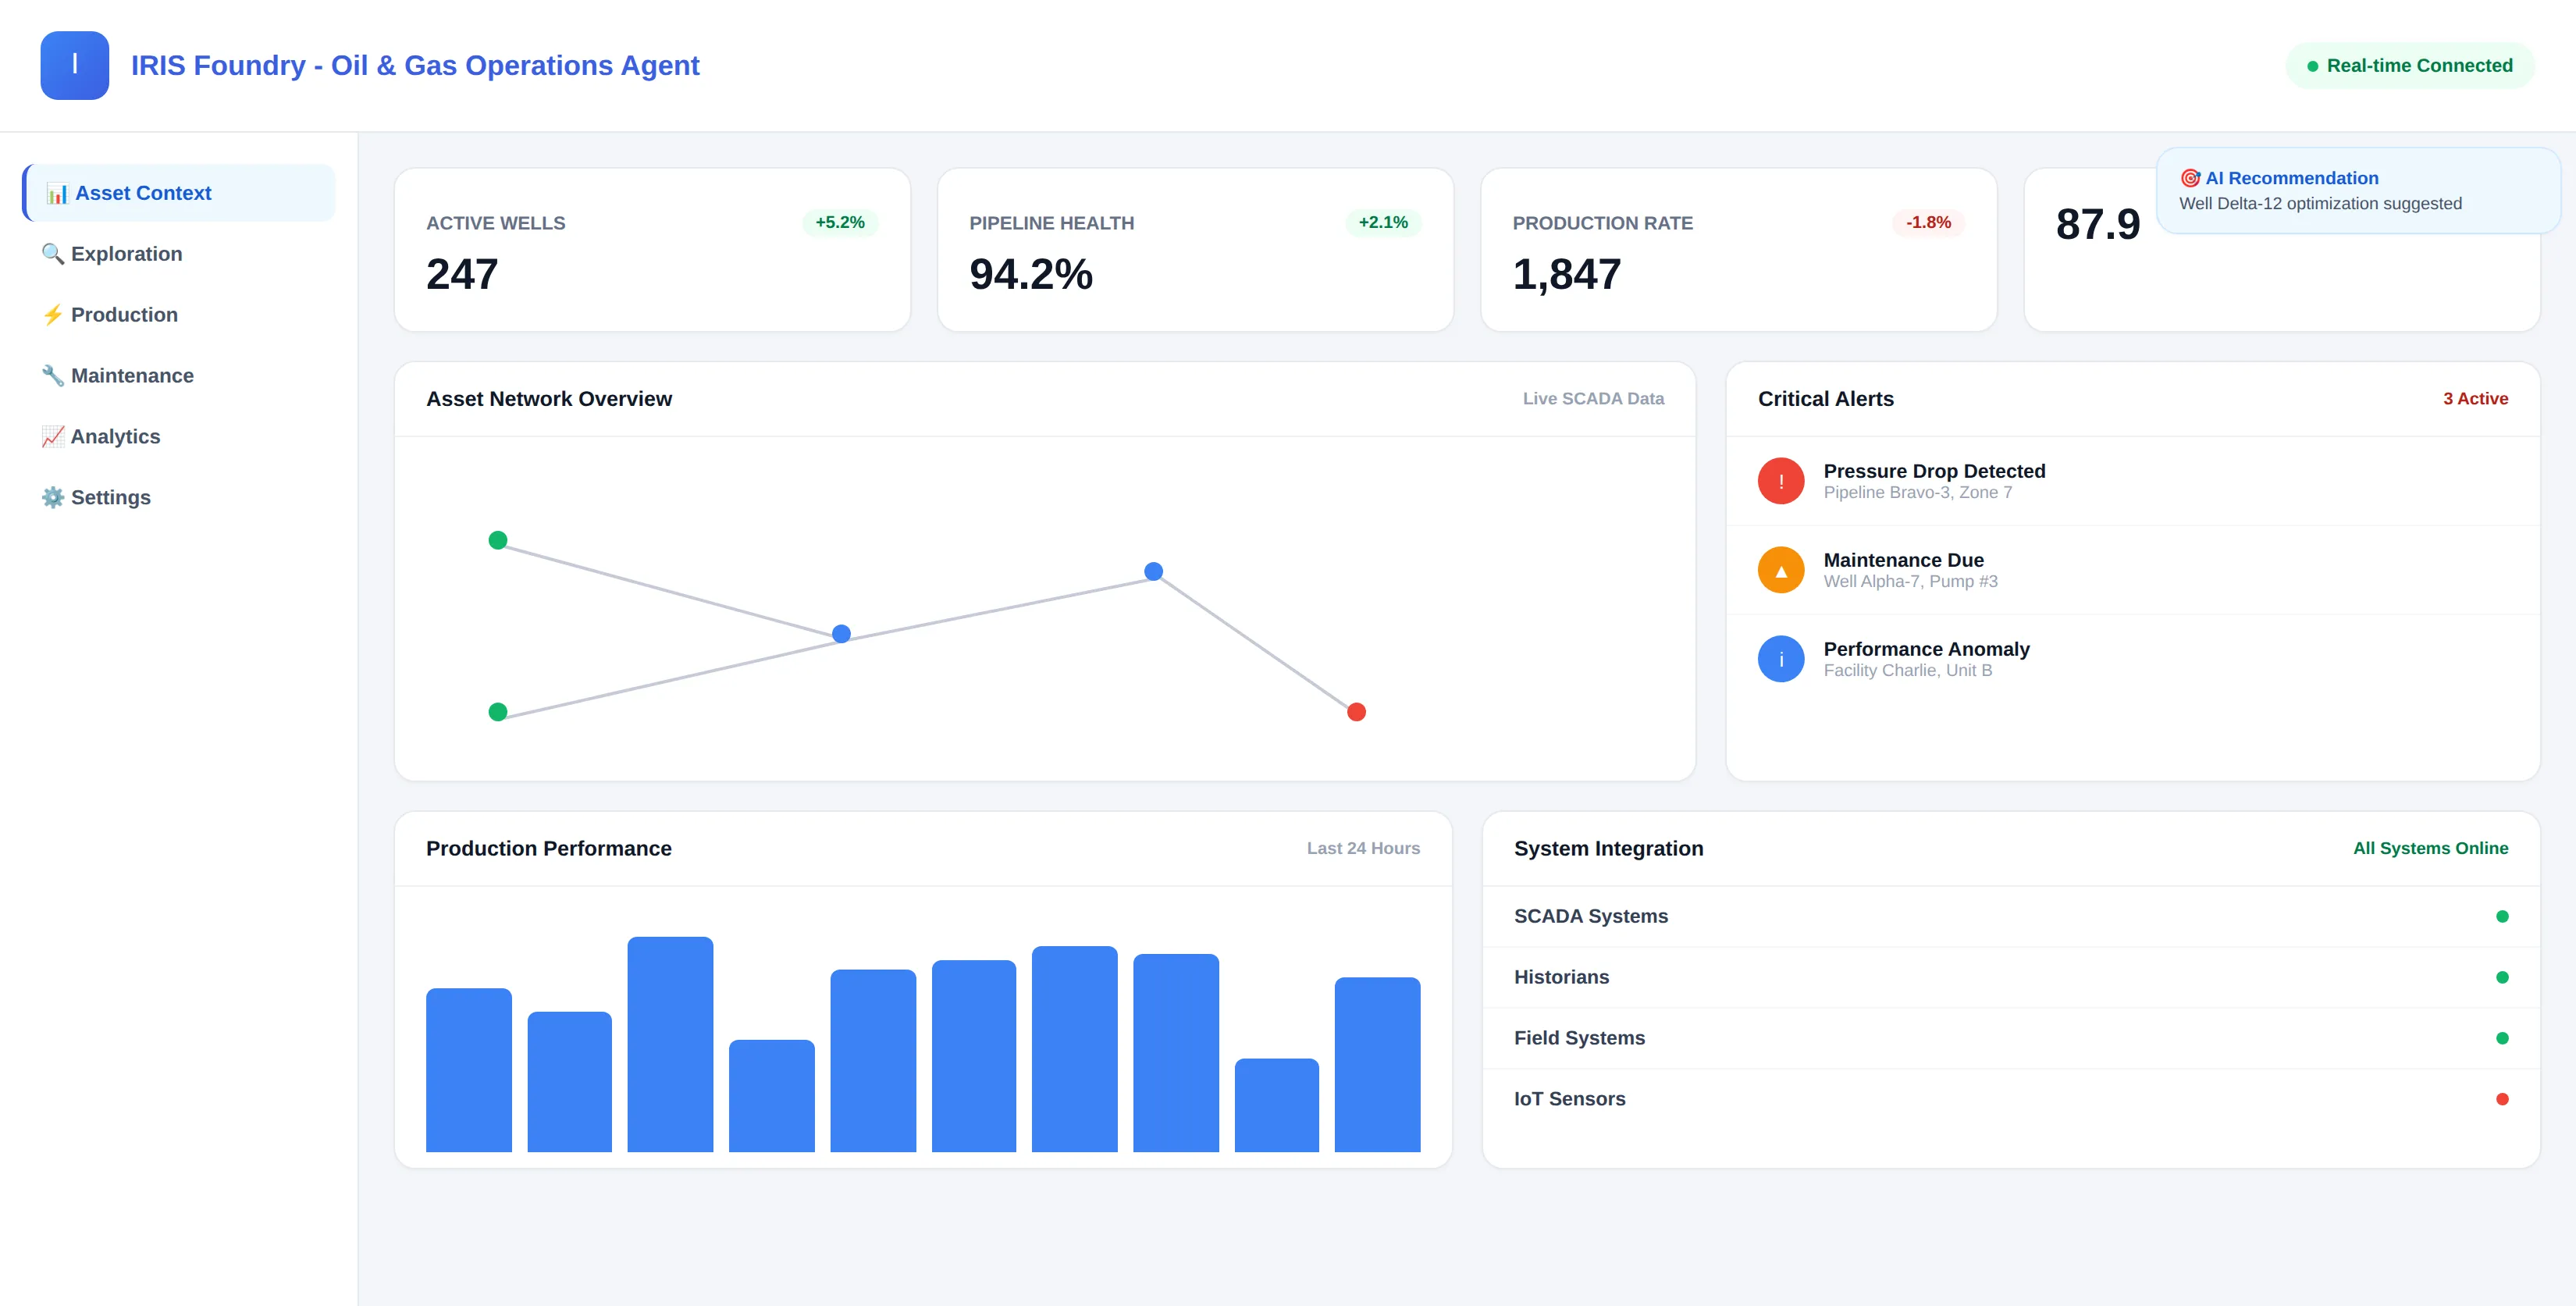
Oil and Gas Operations Agent
Oil and Gas
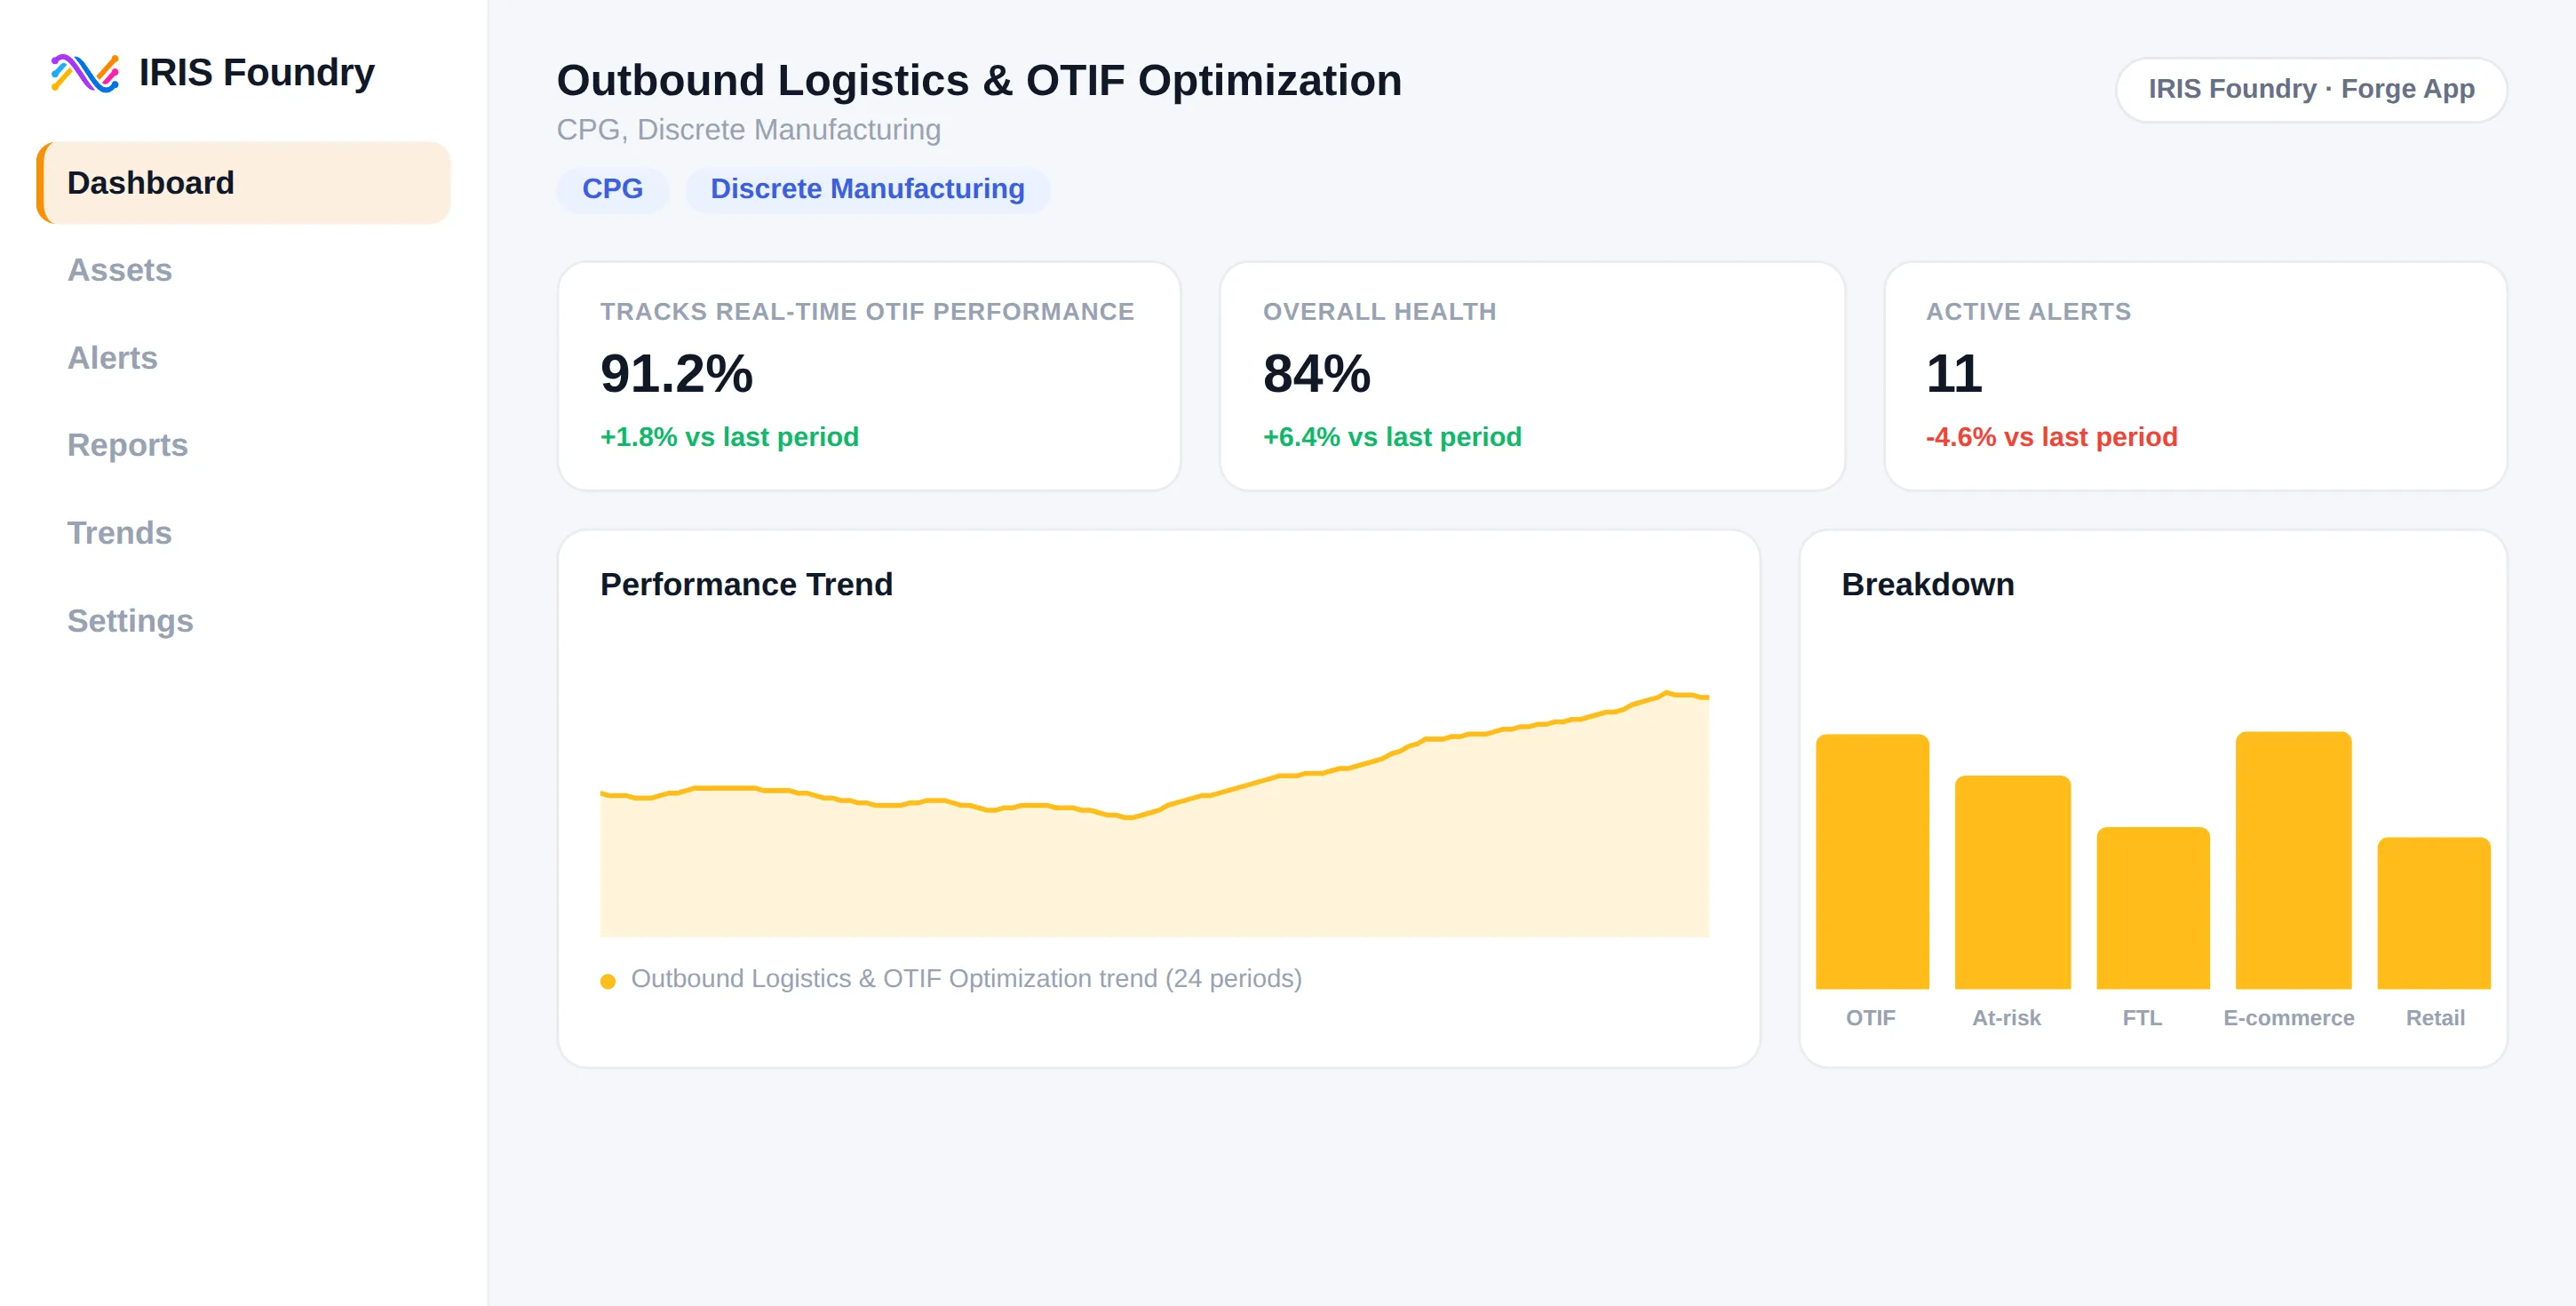
Outbound Logistics and OTIF Optimization
Discrete Manufacturing
CPG
Food and Beverage
Chemical
Pharmaceuticals and Life Sciences
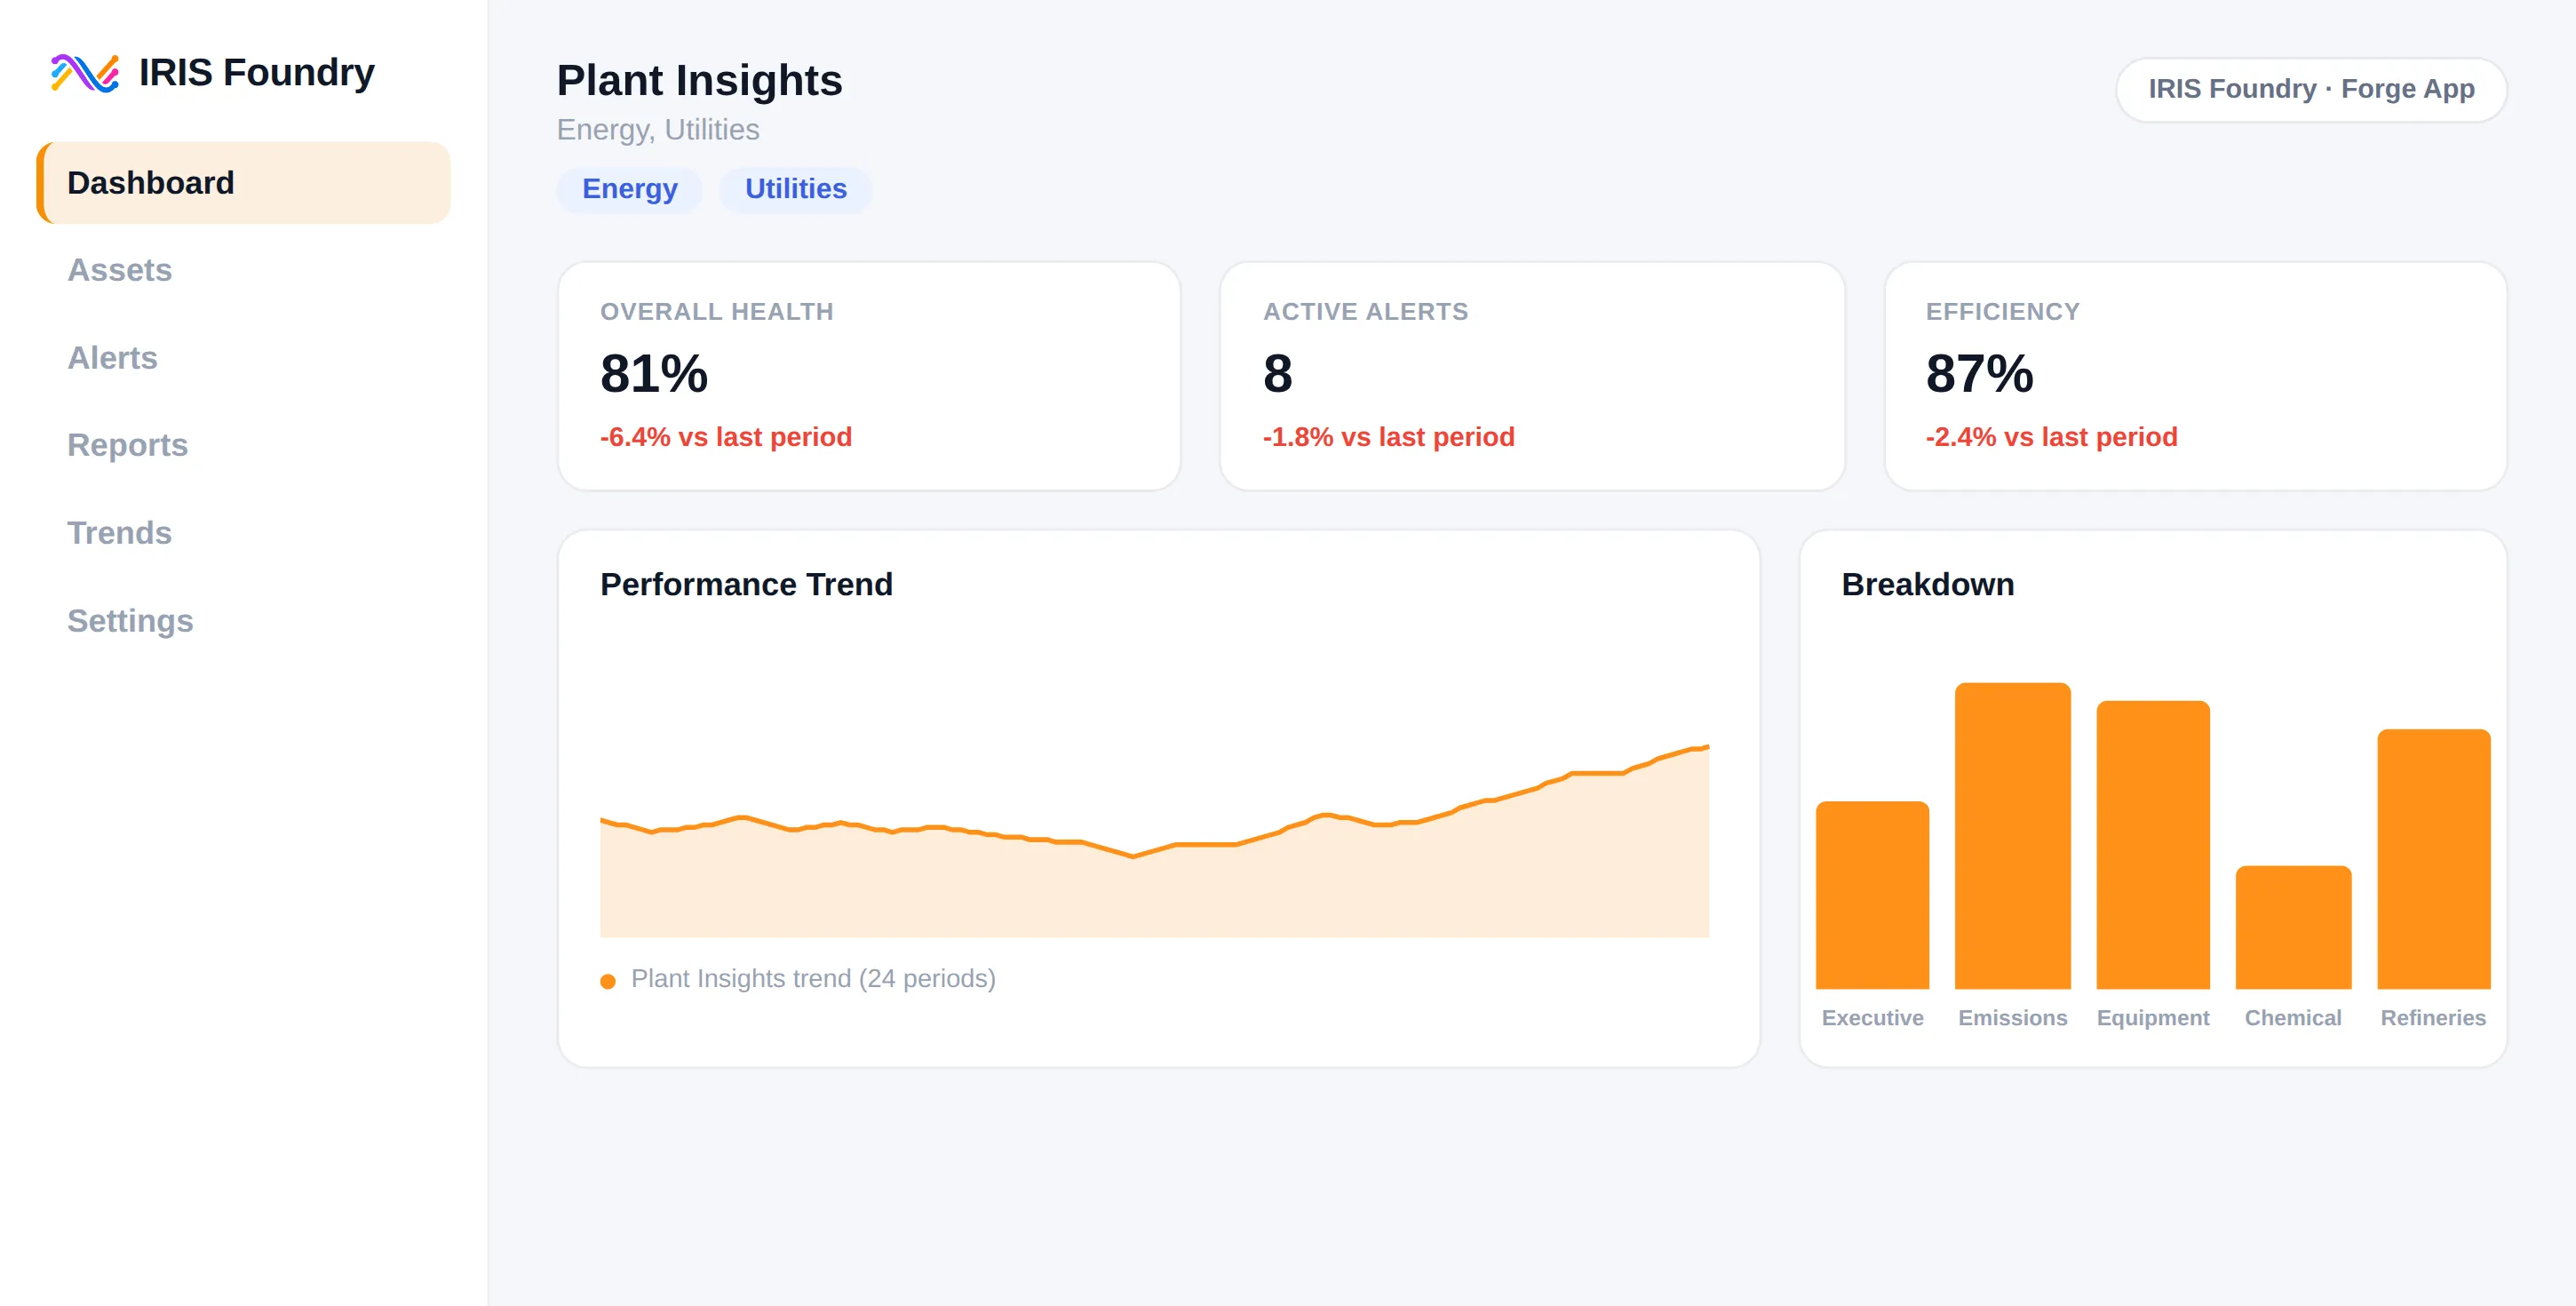
Plant Insights
Energy
Utilities
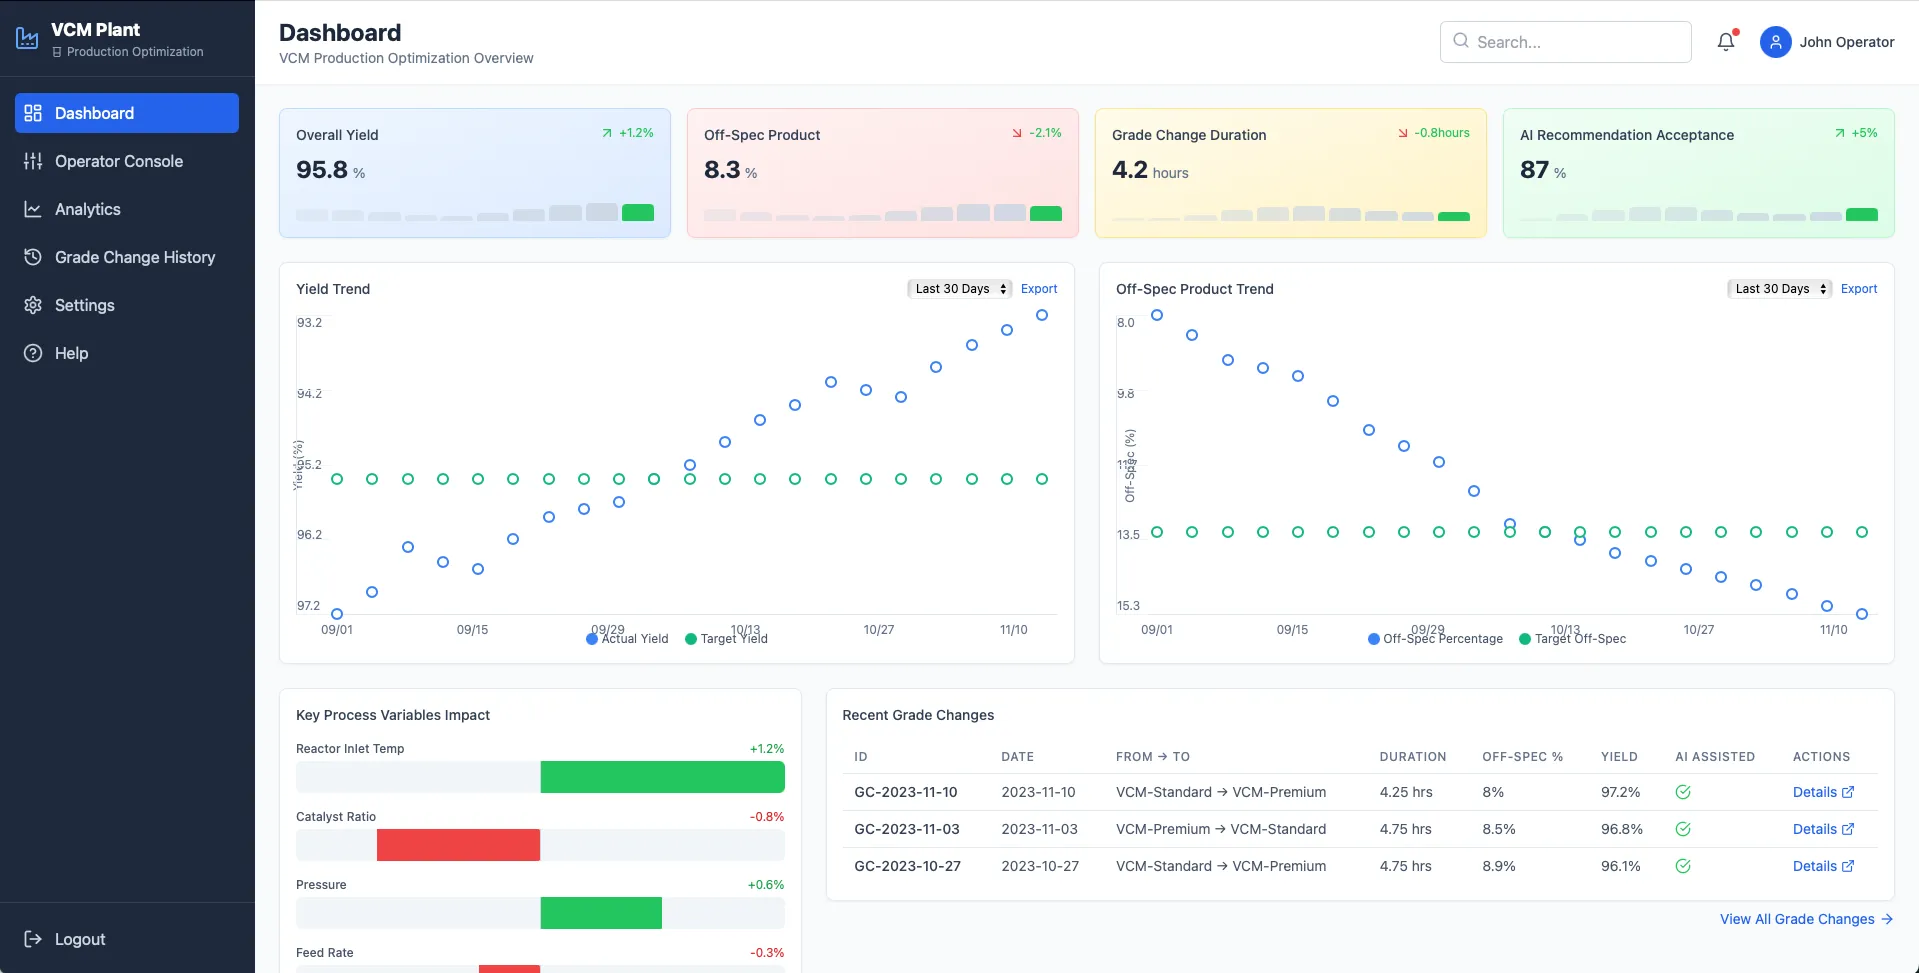
Plant Production Optimization
Chemical
Oil and Gas
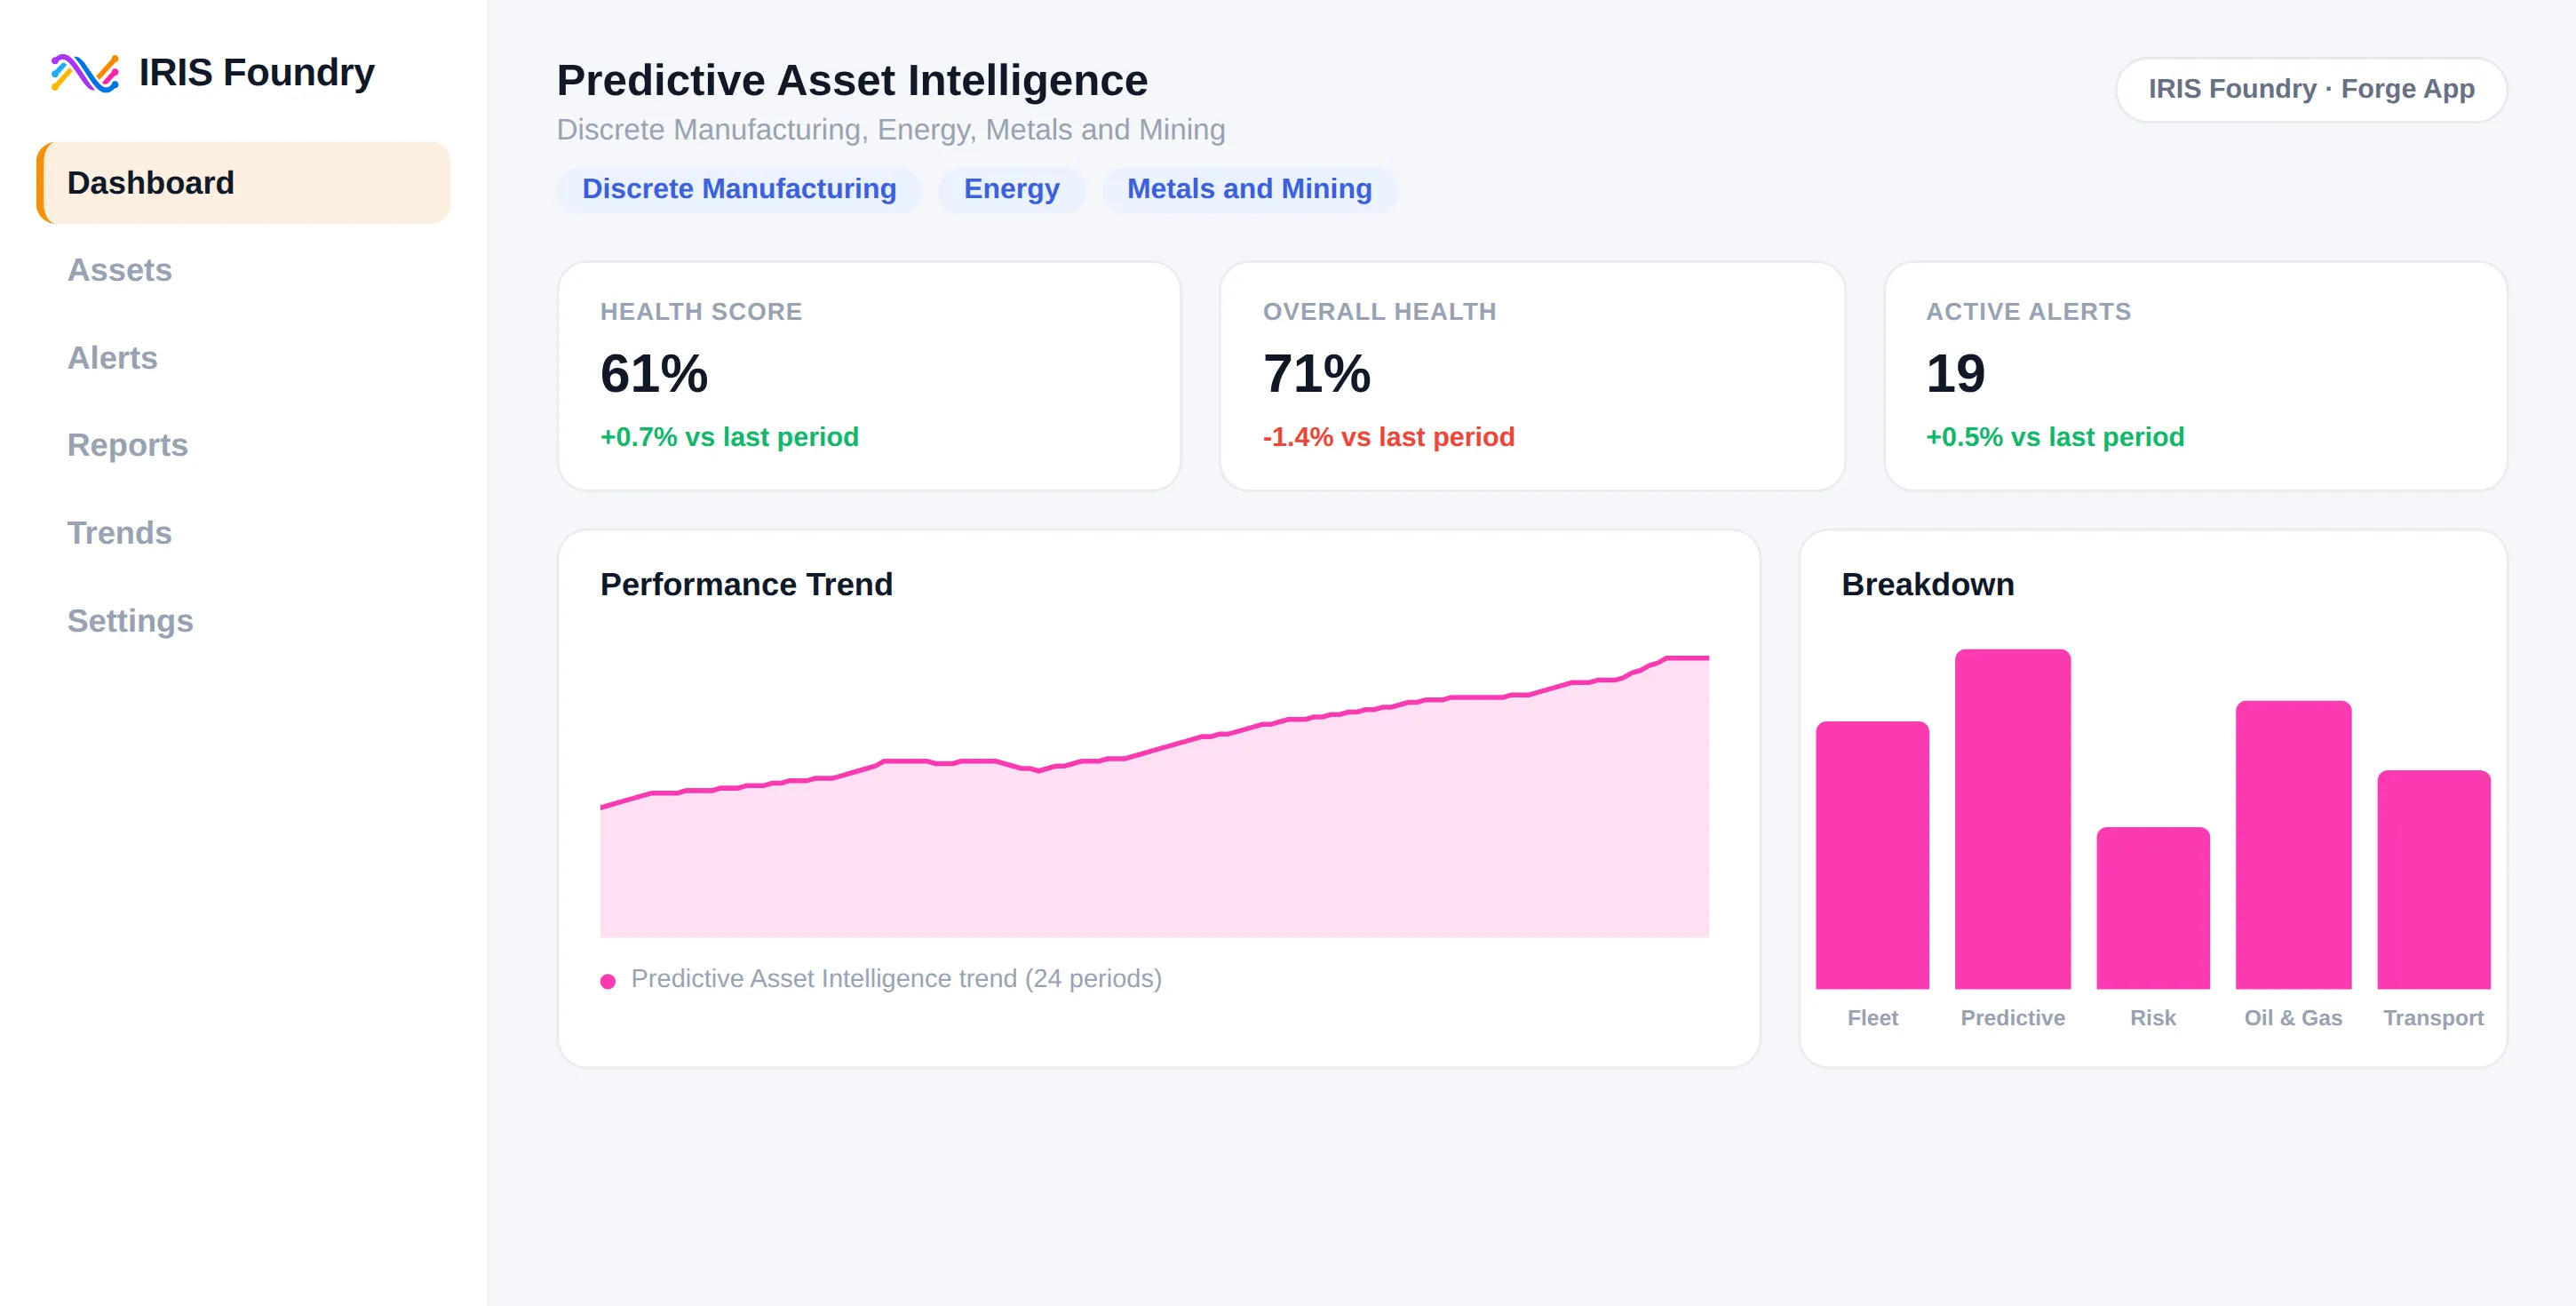
Predictive Asset Intelligence
Discrete Manufacturing
Energy
Metals and Mining
Oil and Gas
Utilities
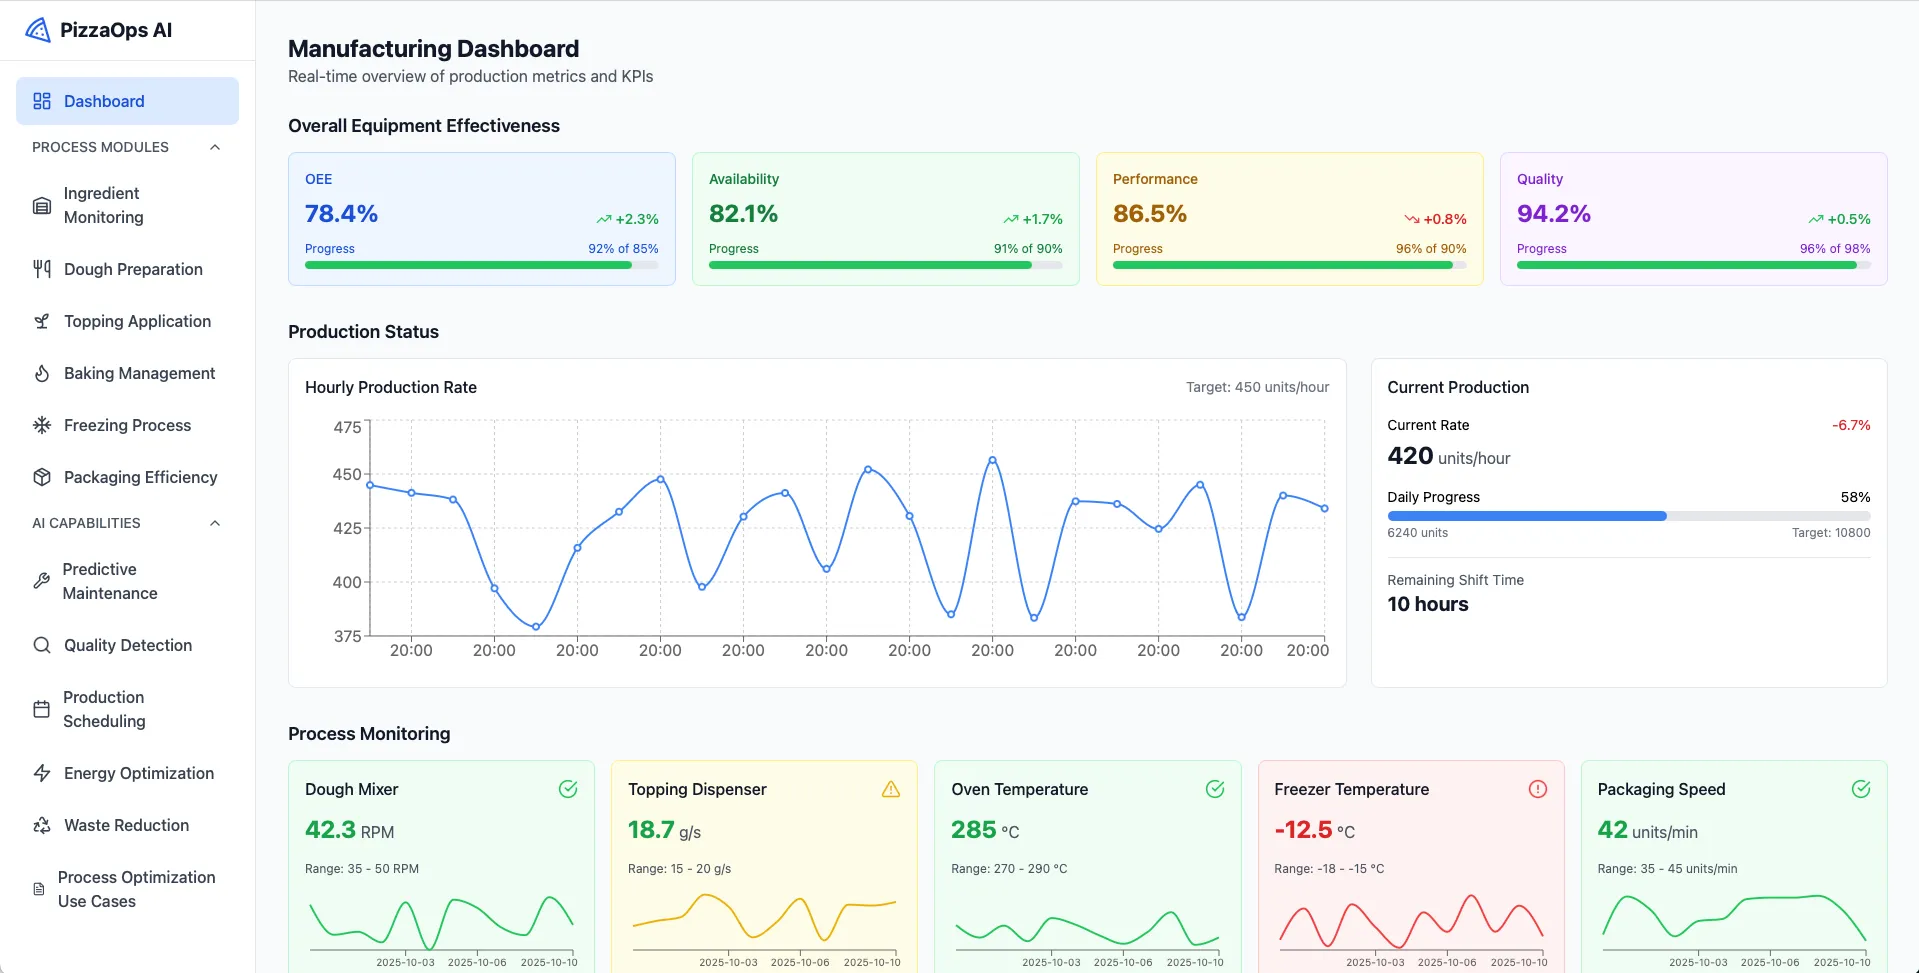
Manufacturing dashboard interface showing real-time production metrics and KPIs for PizzaOps AI, including overall equipment effectiveness with OEE at 78.4%, availability 82.1%, performance 86.5%, and quality 94.2%, each with progress bars and percentage changes. A line graph displays hourly production rate with fluctuations around a 450 units/hour target. Current production is 420 units/hour with a 6.7% decrease, daily progress at 58%, and 10 hours remaining shift time. Process monitoring shows Dough Mixer speed at 42.3 RPM, Topping Dispenser flow at 18.7 g/s (alert), Oven Temperature at 285°C, Freezer Temperature at -12.5°C (warning), and Packaging Speed at 42 units/min, each with recent trend graphs and ranges. The left sidebar navigates process modules and AI capabilities.
Production Operations Management
Food and Beverage
CPG
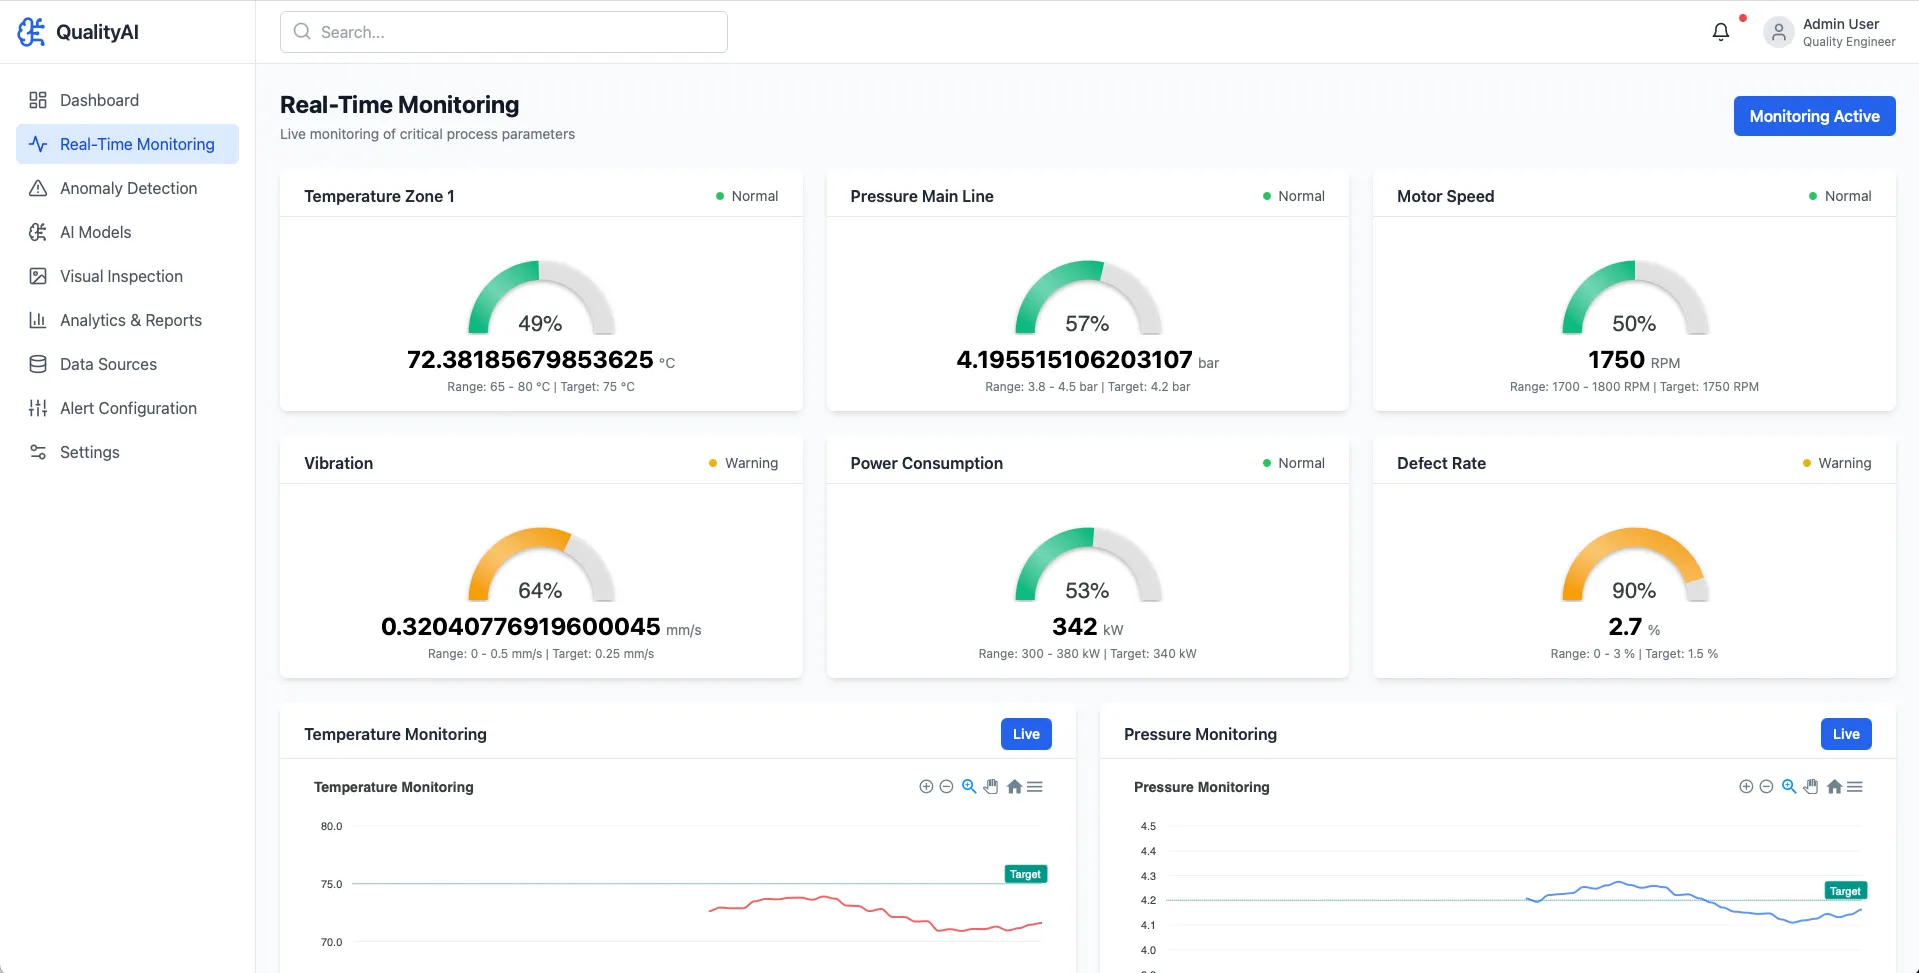
QualityAI dashboard showing real-time monitoring of process parameters: Temperature Zone 1 at 72.38°C (49%, normal), Pressure Main Line at 4.20 bar (57%, normal), Motor Speed at 1750 RPM (50%, normal), Vibration at 0.32 mm/s (64%, warning), Power Consumption at 342 kW (53%, normal), and Defect Rate at 2.7% (90%, warning). Below are live graphs for Temperature Monitoring and Pressure Monitoring illustrating trends against target values.
Quality Management Ops
Discrete Manufacturing
CPG
Food and Beverage
Chemical
Pharmaceuticals and Life Sciences
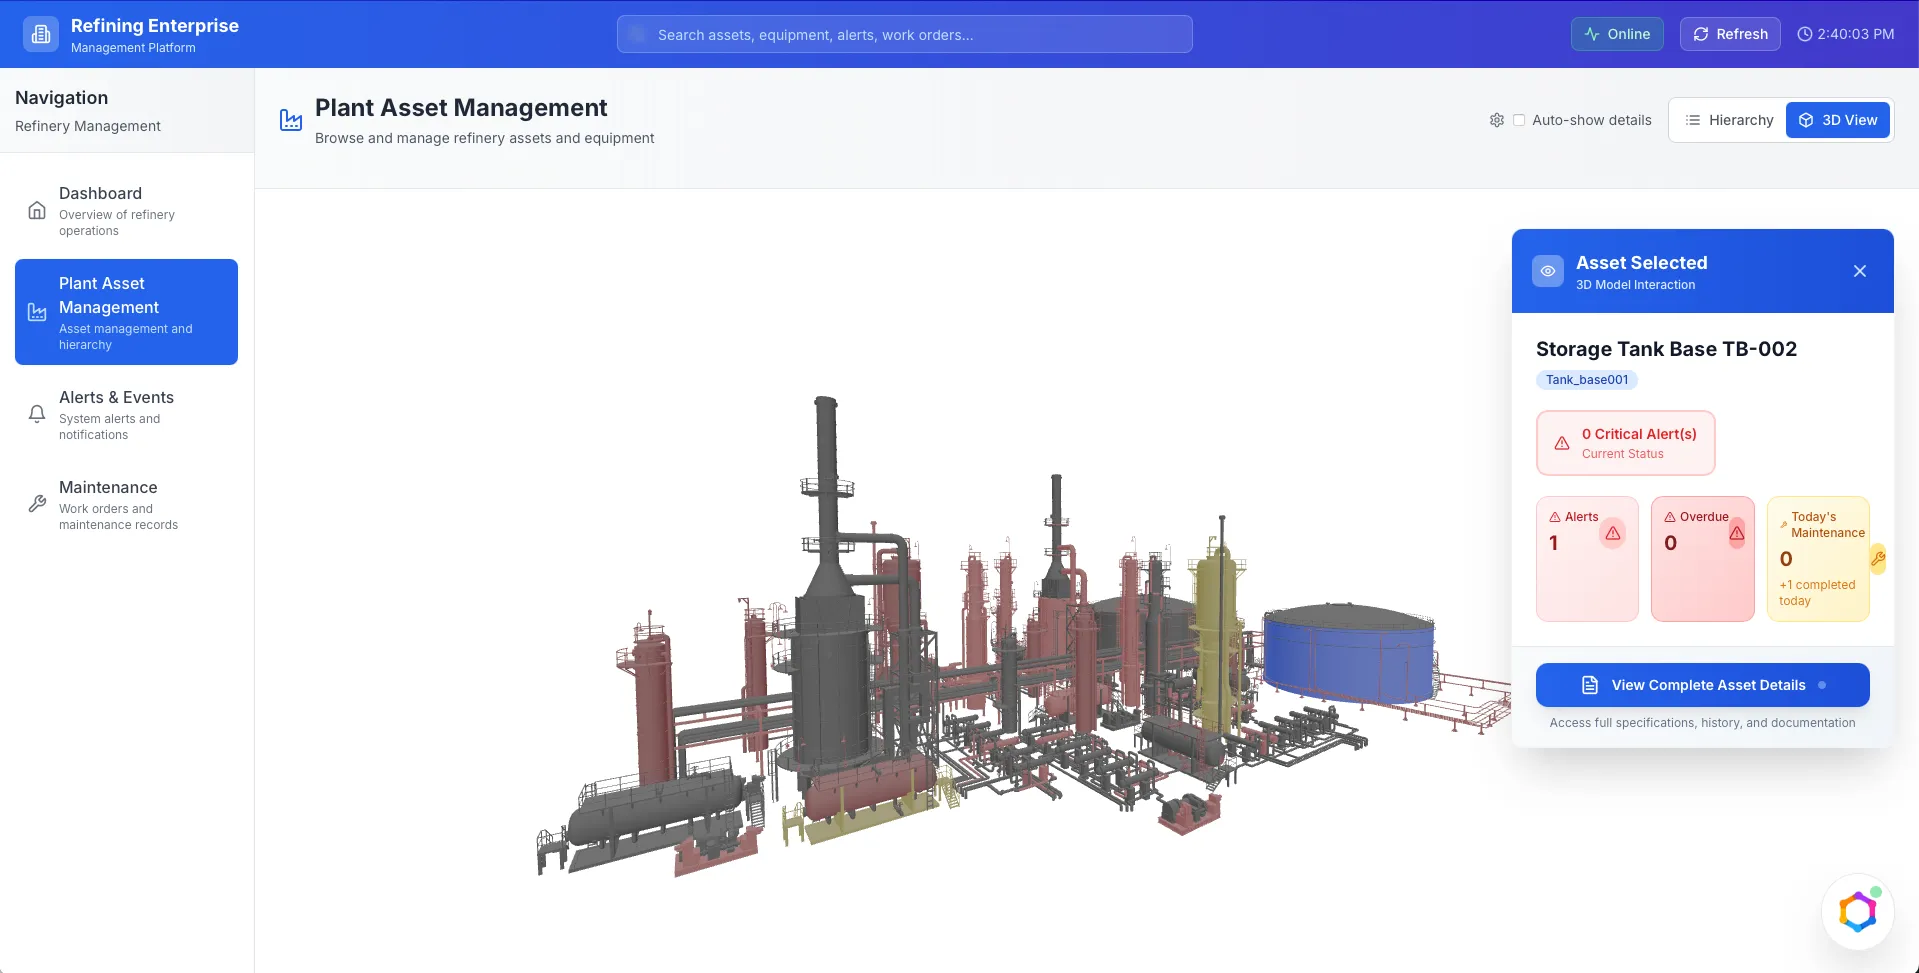
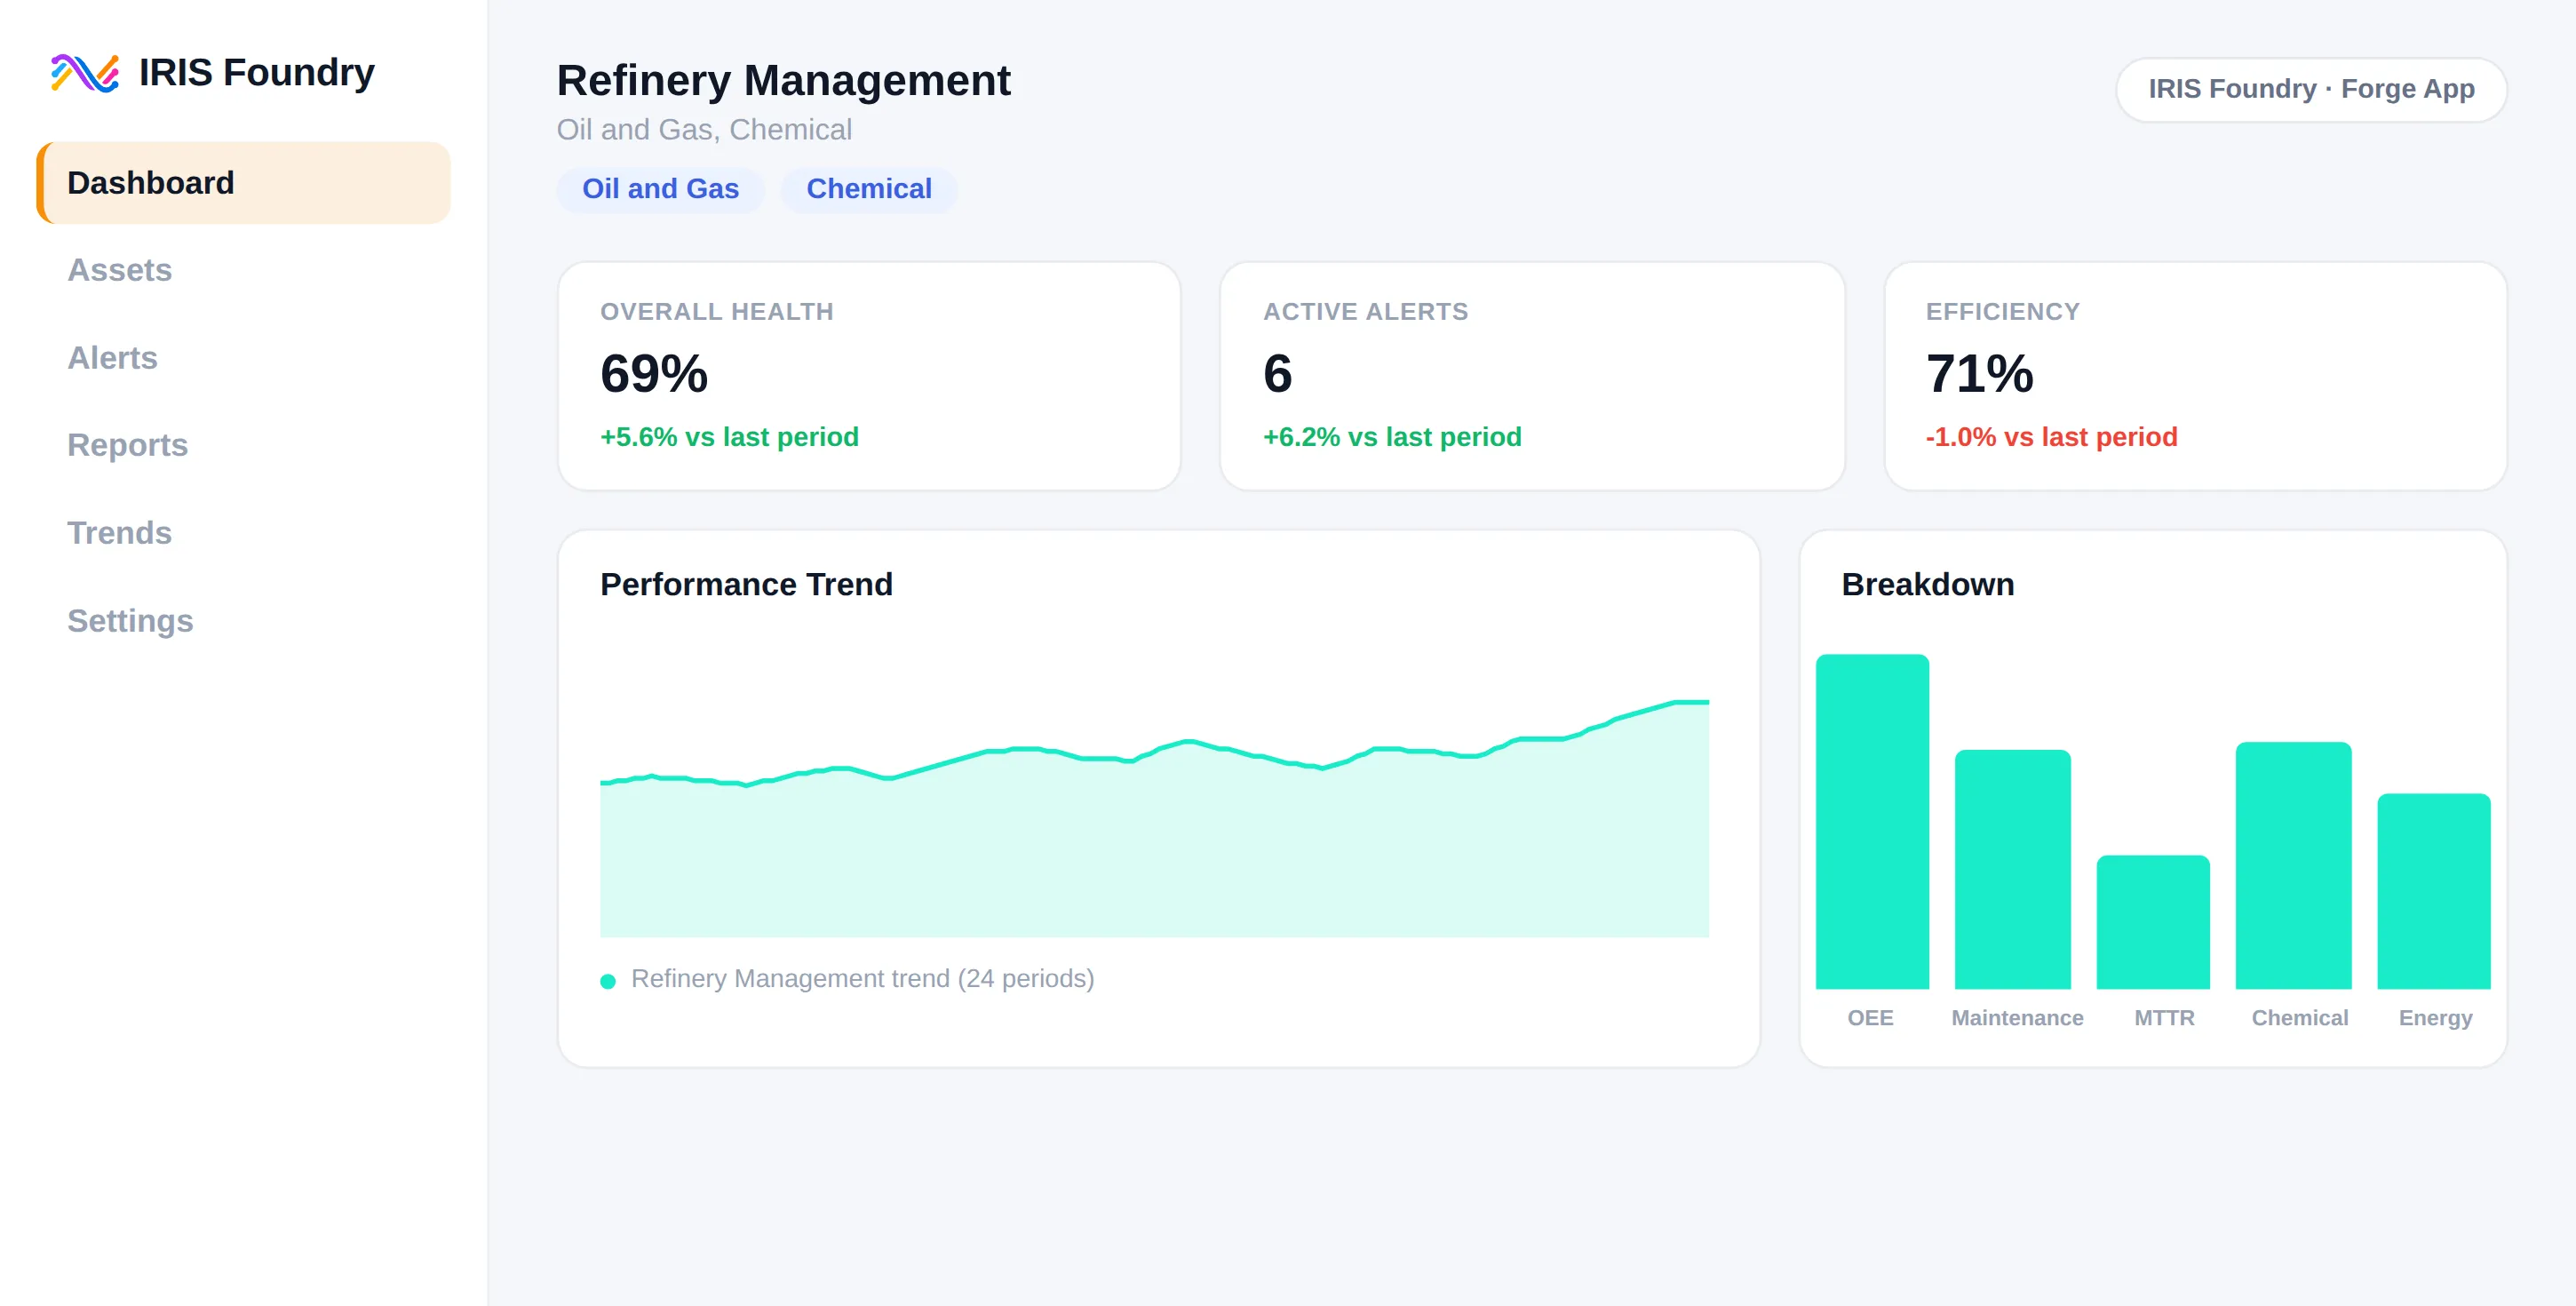
Refinery Management
Oil and Gas
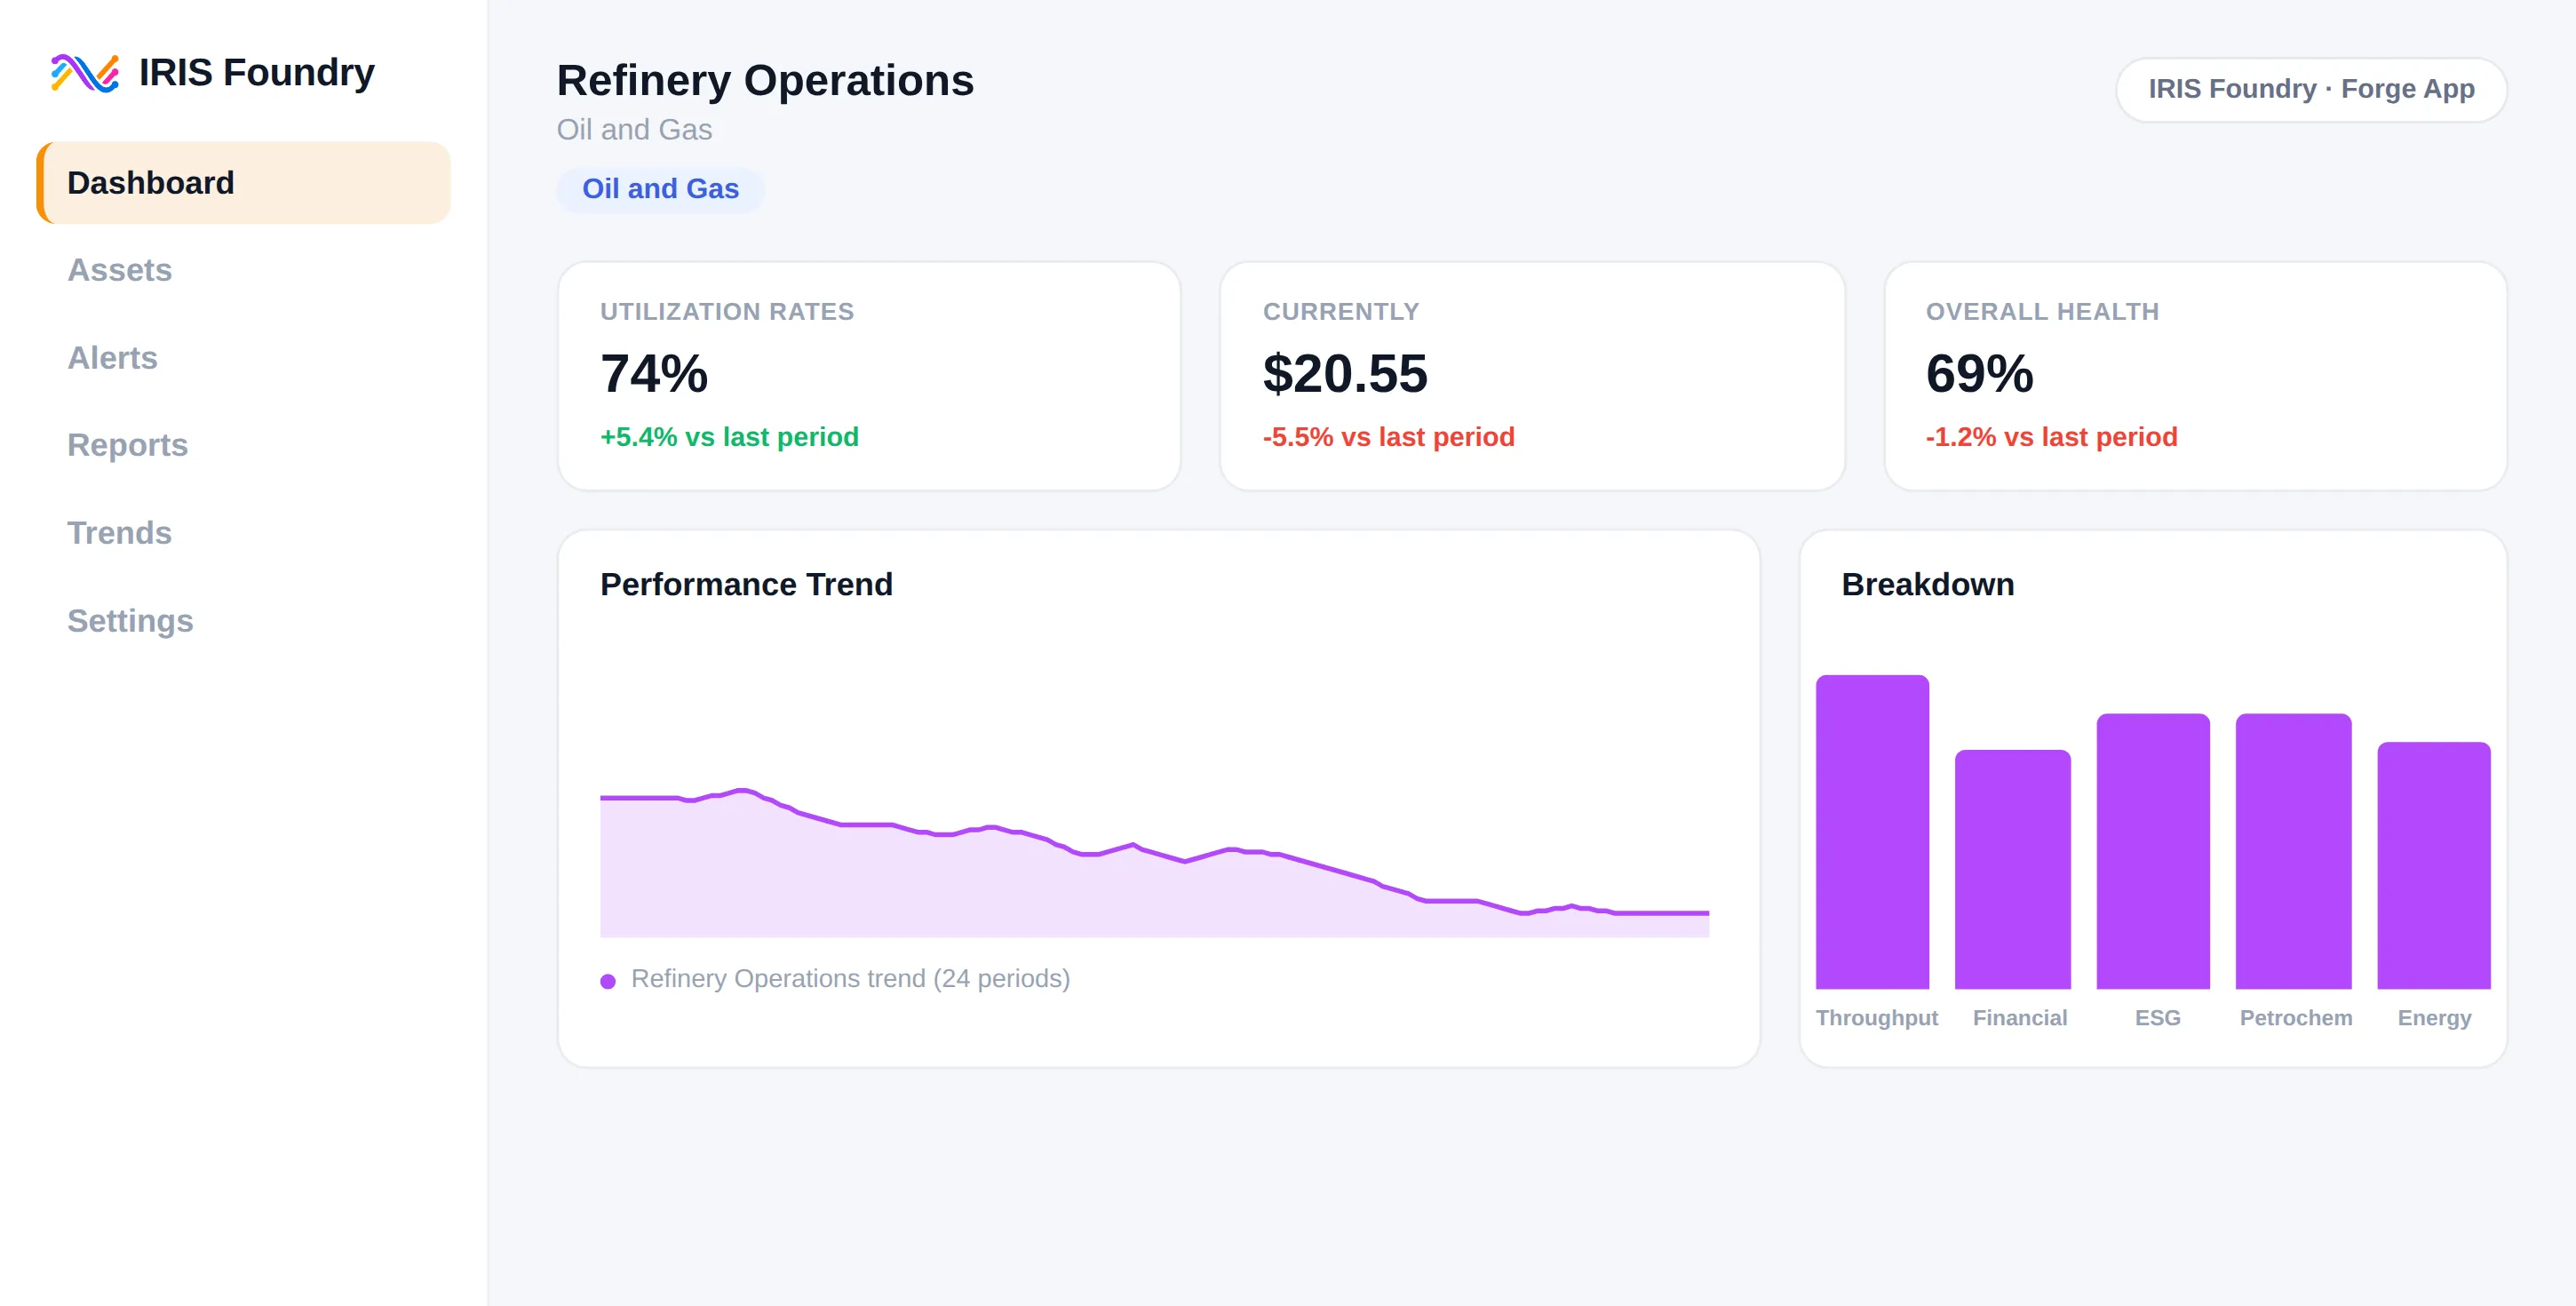
Refinery Operations
Oil and Gas
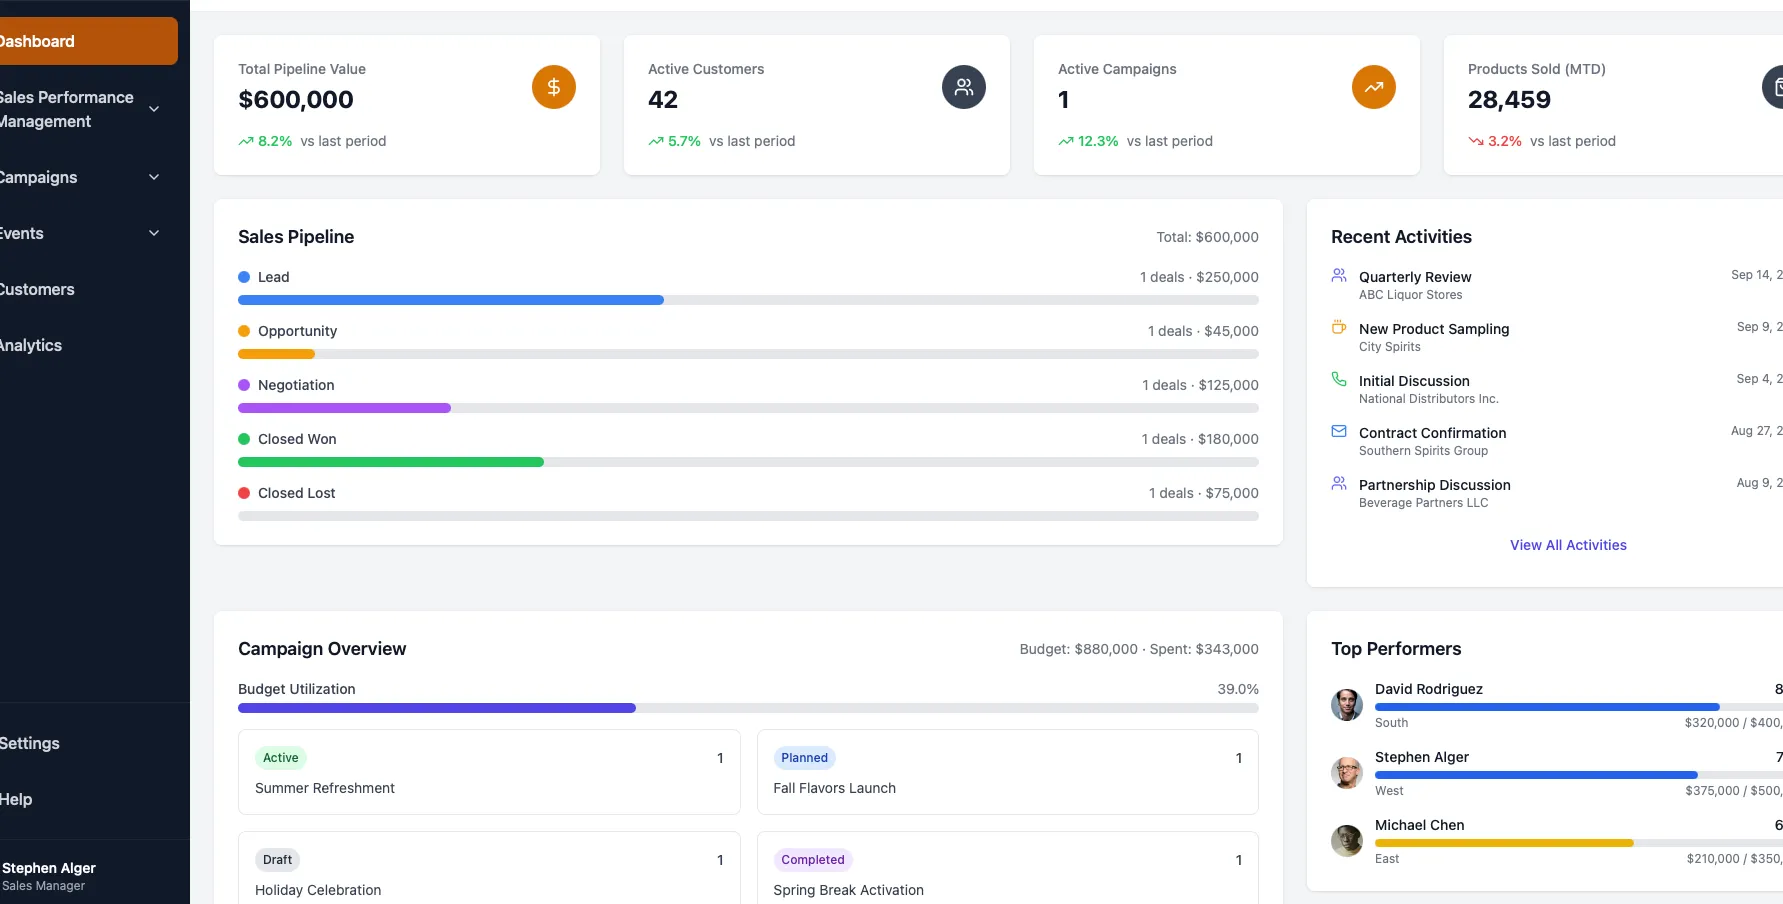
Sales Planning App
Discrete Manufacturing
CPG
Food and Beverage
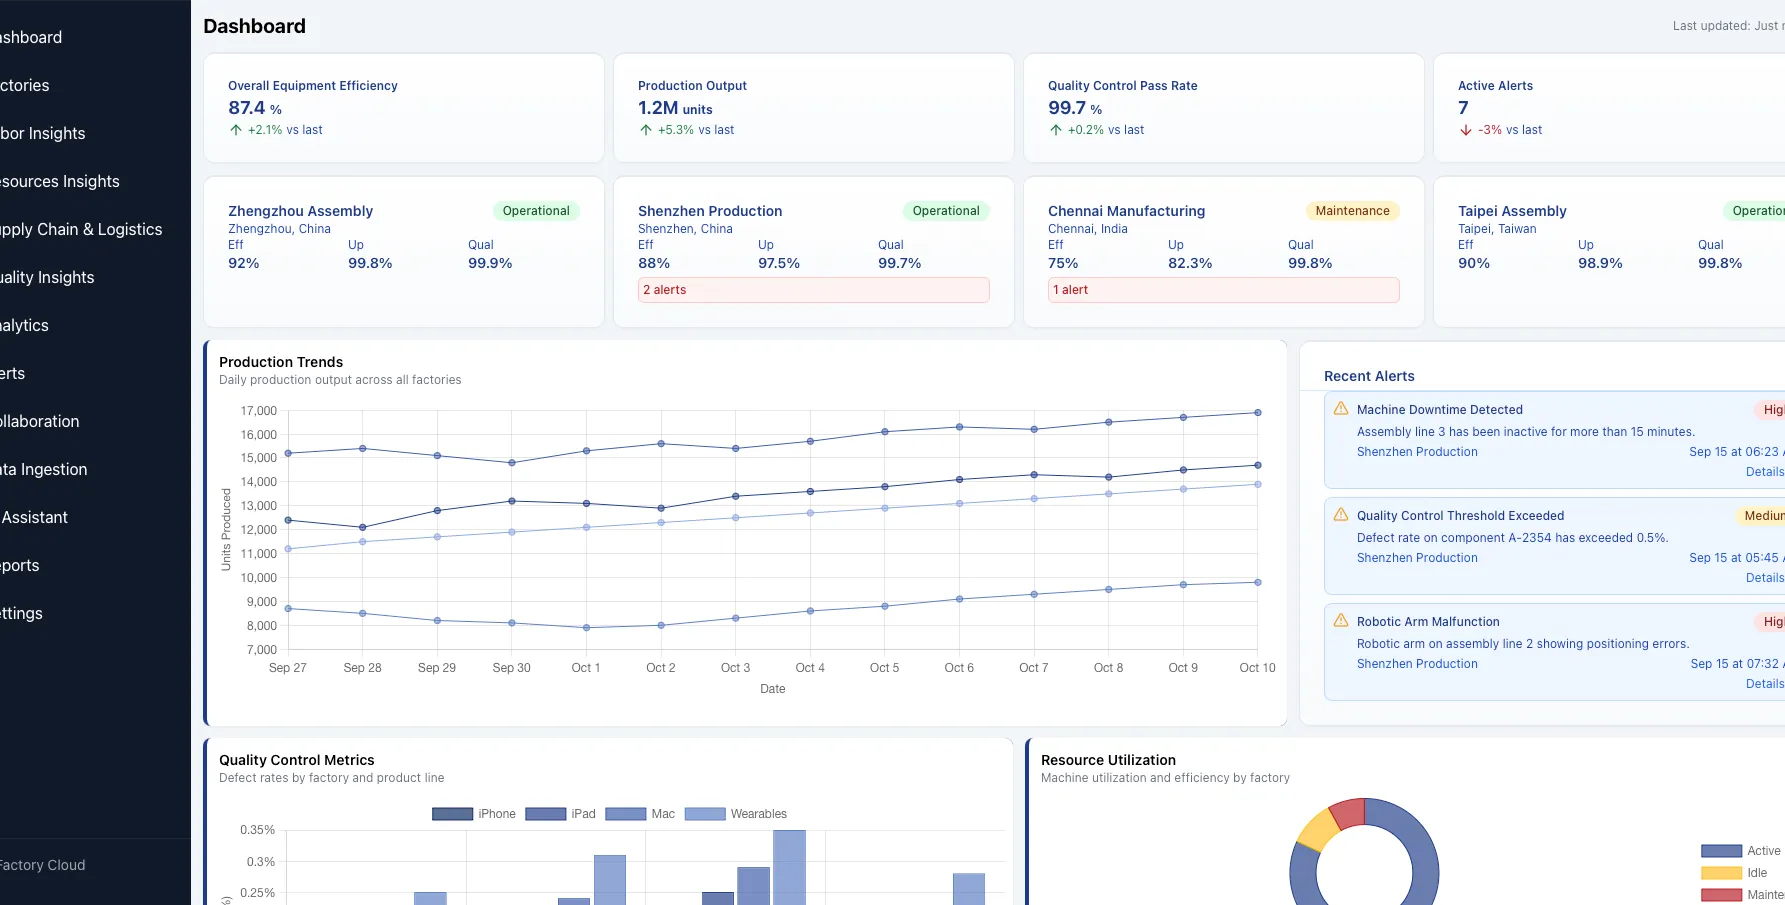
Smart Factory
Discrete Manufacturing
CPG
Food and Beverage
Chemical
Pharmaceuticals and Life Sciences
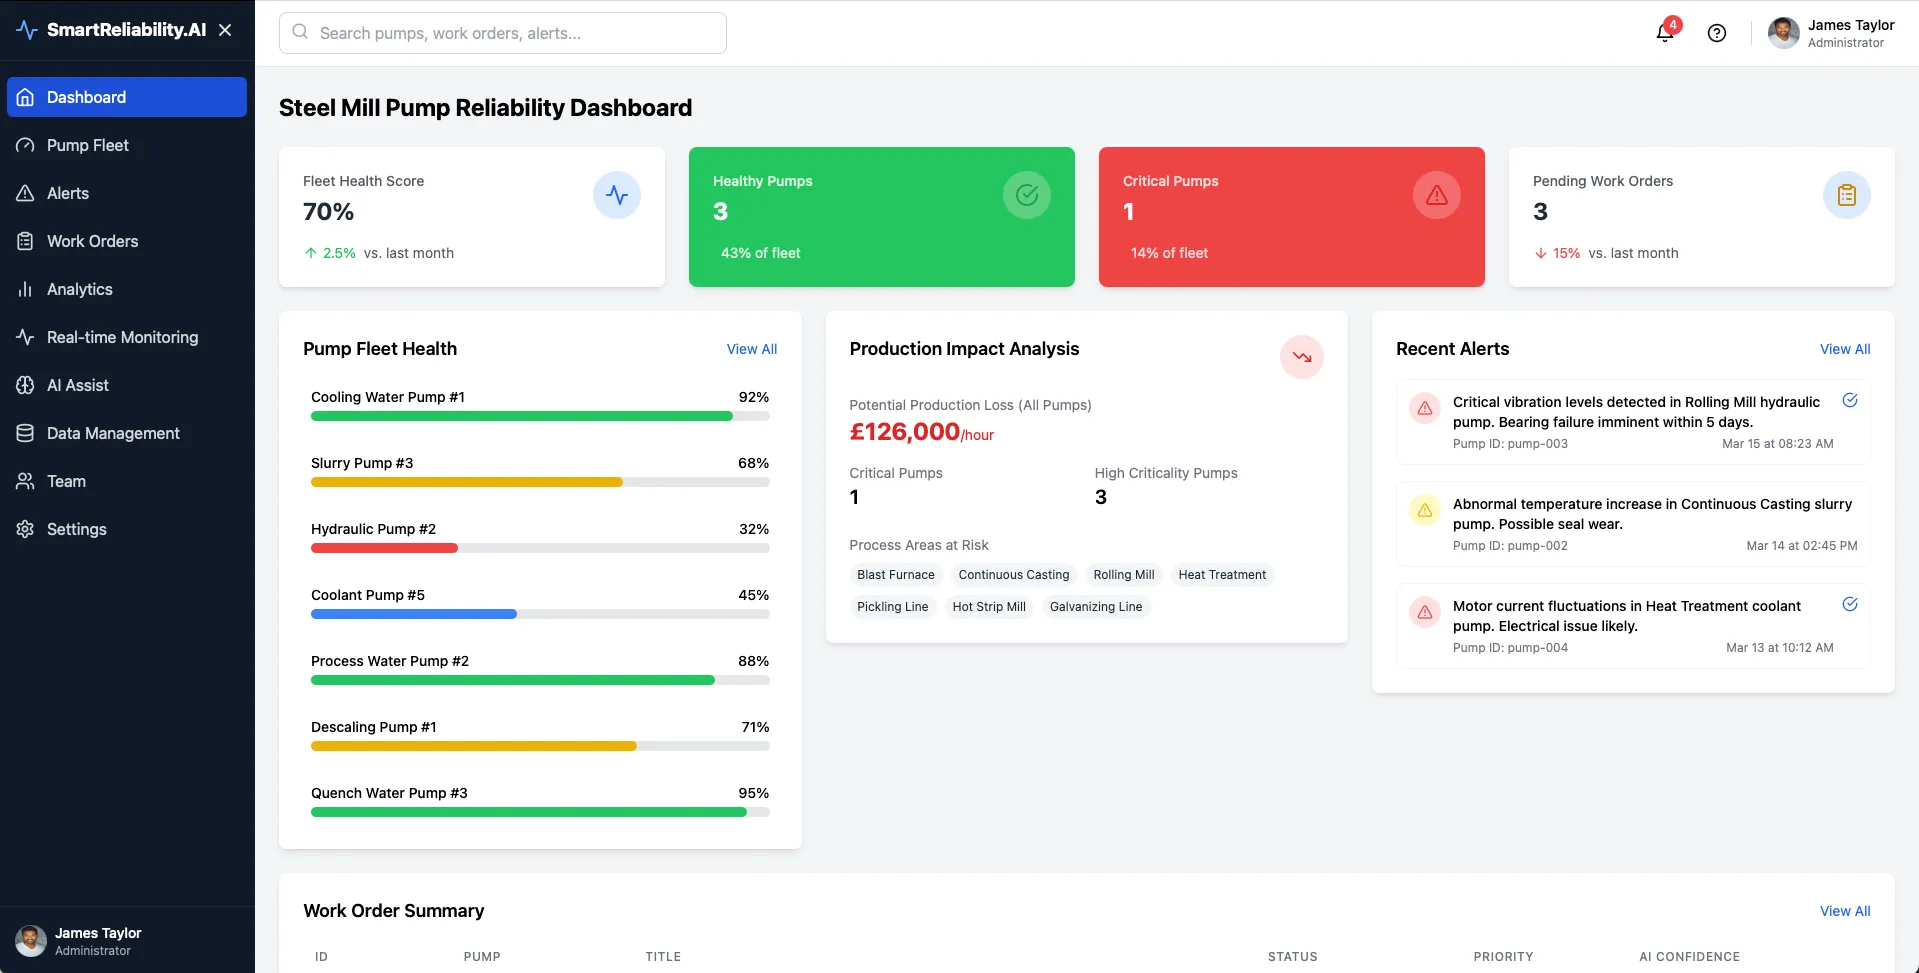
SmartReliability
Metals and Mining
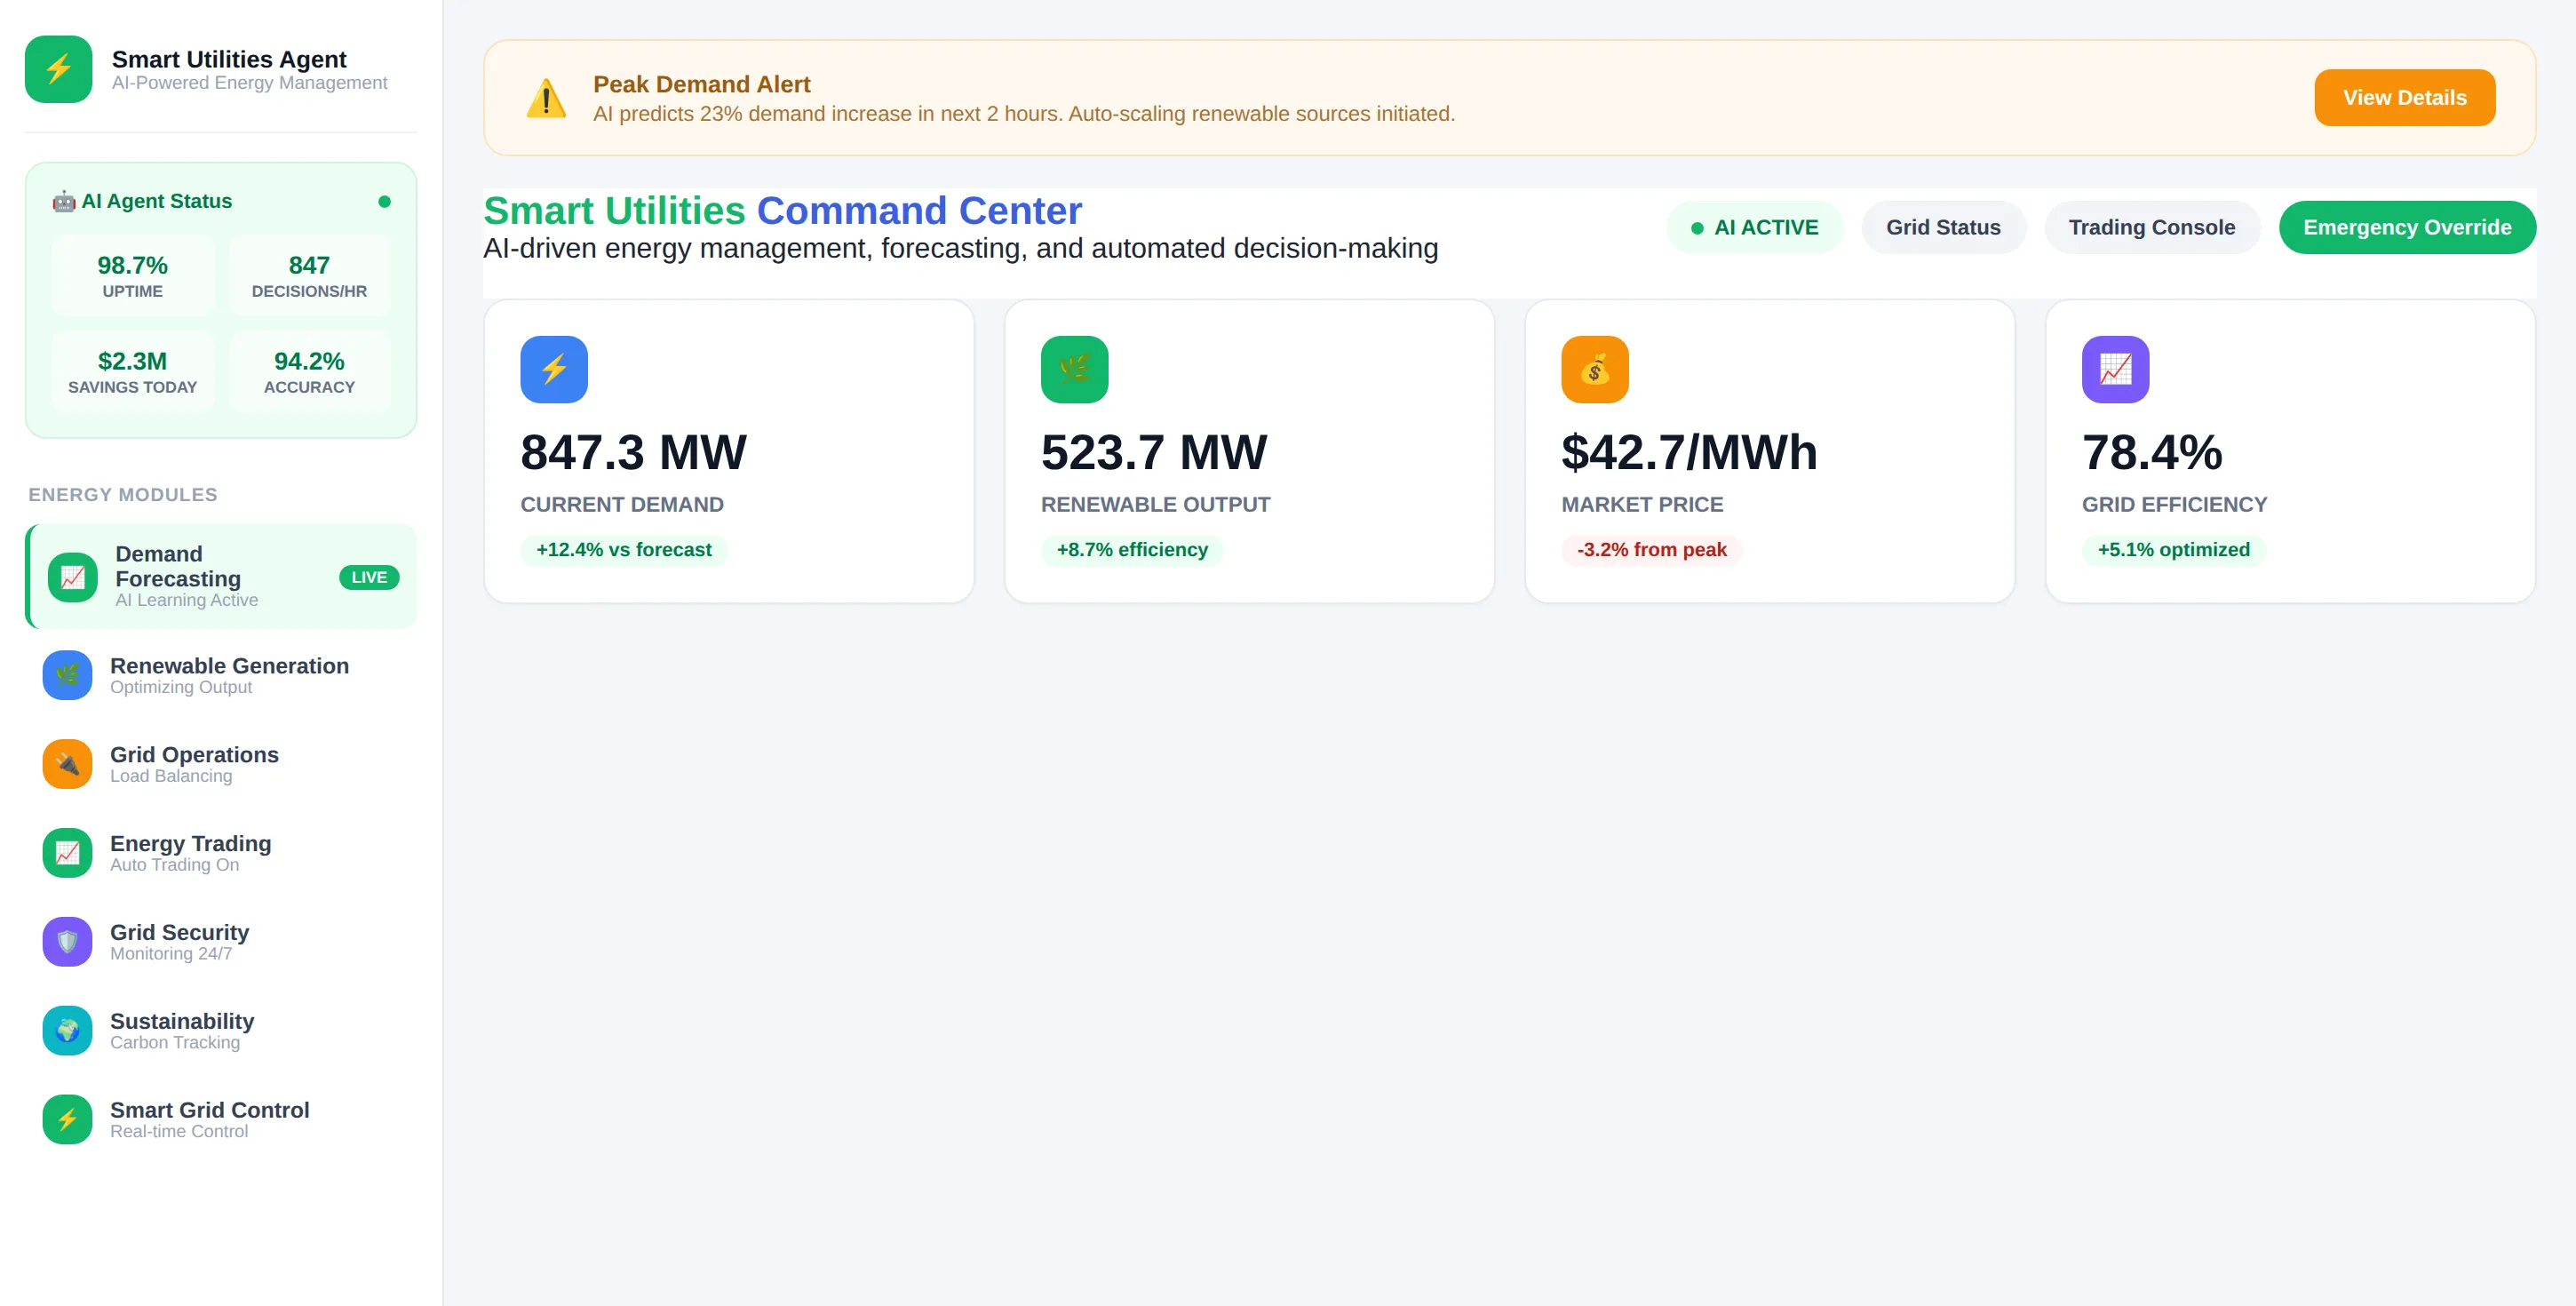
Smart Utilities Agent
Utilities
Energy
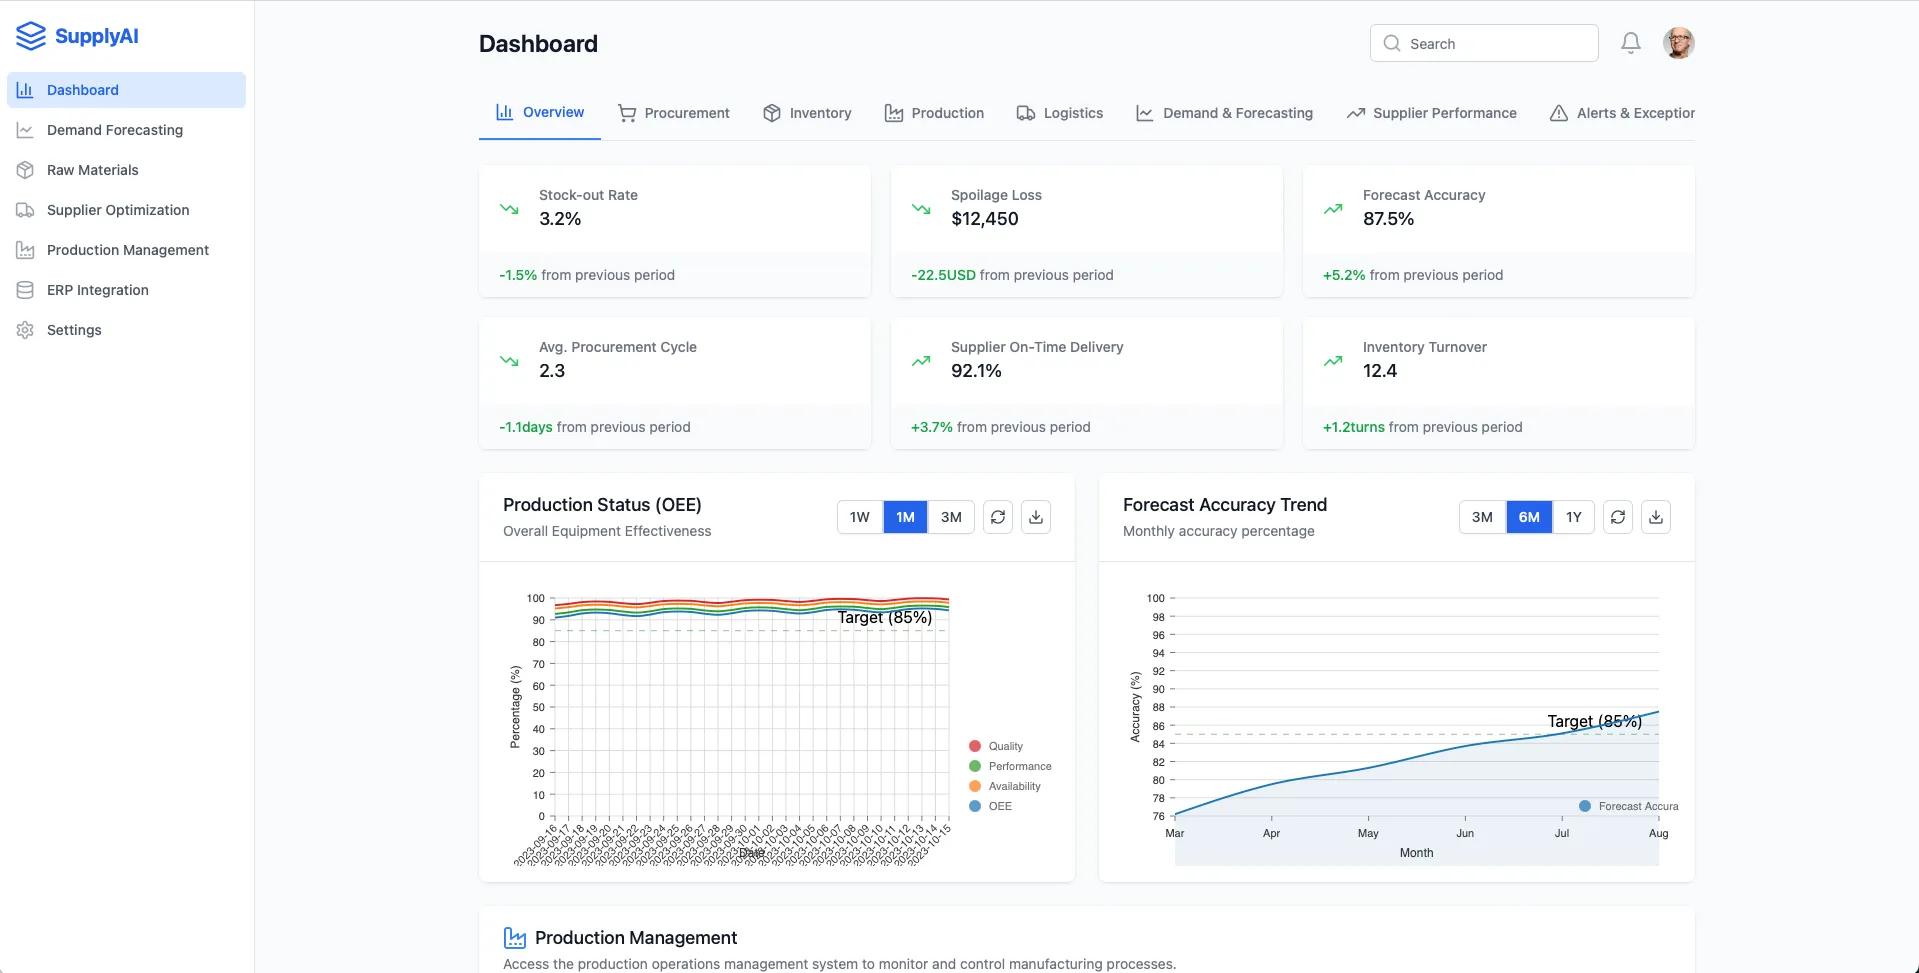
SupplyAI
Discrete Manufacturing
CPG
Food and Beverage
Chemical
Pharmaceuticals and Life Sciences
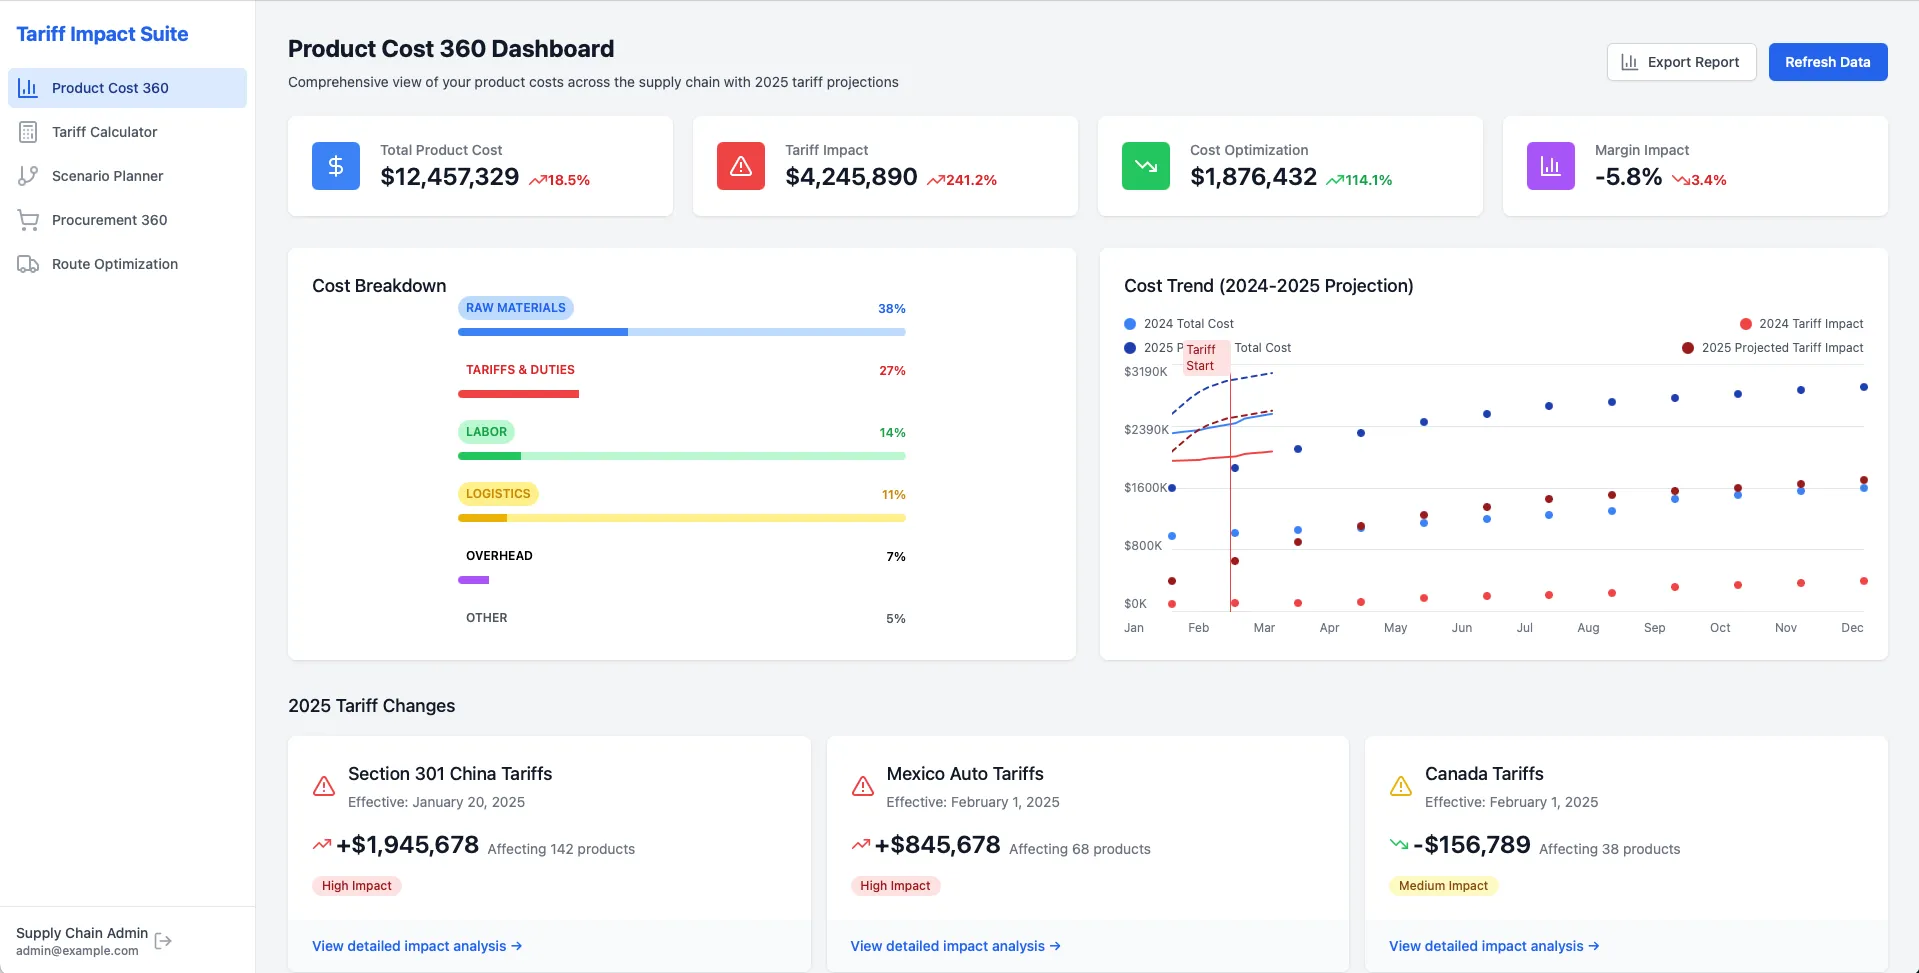
Supply Chain Cost/Tariff Analyzer
Discrete Manufacturing
CPG
Food and Beverage
Chemical
Pharmaceuticals and Life Sciences
SupplyChain OS Enterprise Edition warehouse management dashboard showing capacity 50,000 sq ft with 82% utilization, inventory 12,500 items valued at $4.25M, workforce of 124 employees with 88.7% productivity, and 12 automated guided vehicles with 83% active rate. Metrics include space utilization 82%, picking accuracy 99.2%, order fulfillment time 1.8 days, and inventory turnover 12.4x with weekly changes. Capacity utilization trend graph shows steady increase from 65% to 85% usage from March to September 2023. Inventory distribution pie chart breaks down into Electronics 35%, Apparel 25%, Home Goods 20%, Sporting Goods 10%, and Other 10%.
Supply Chain Operations
Discrete Manufacturing
CPG
Food and Beverage
Chemical
Pharmaceuticals and Life Sciences
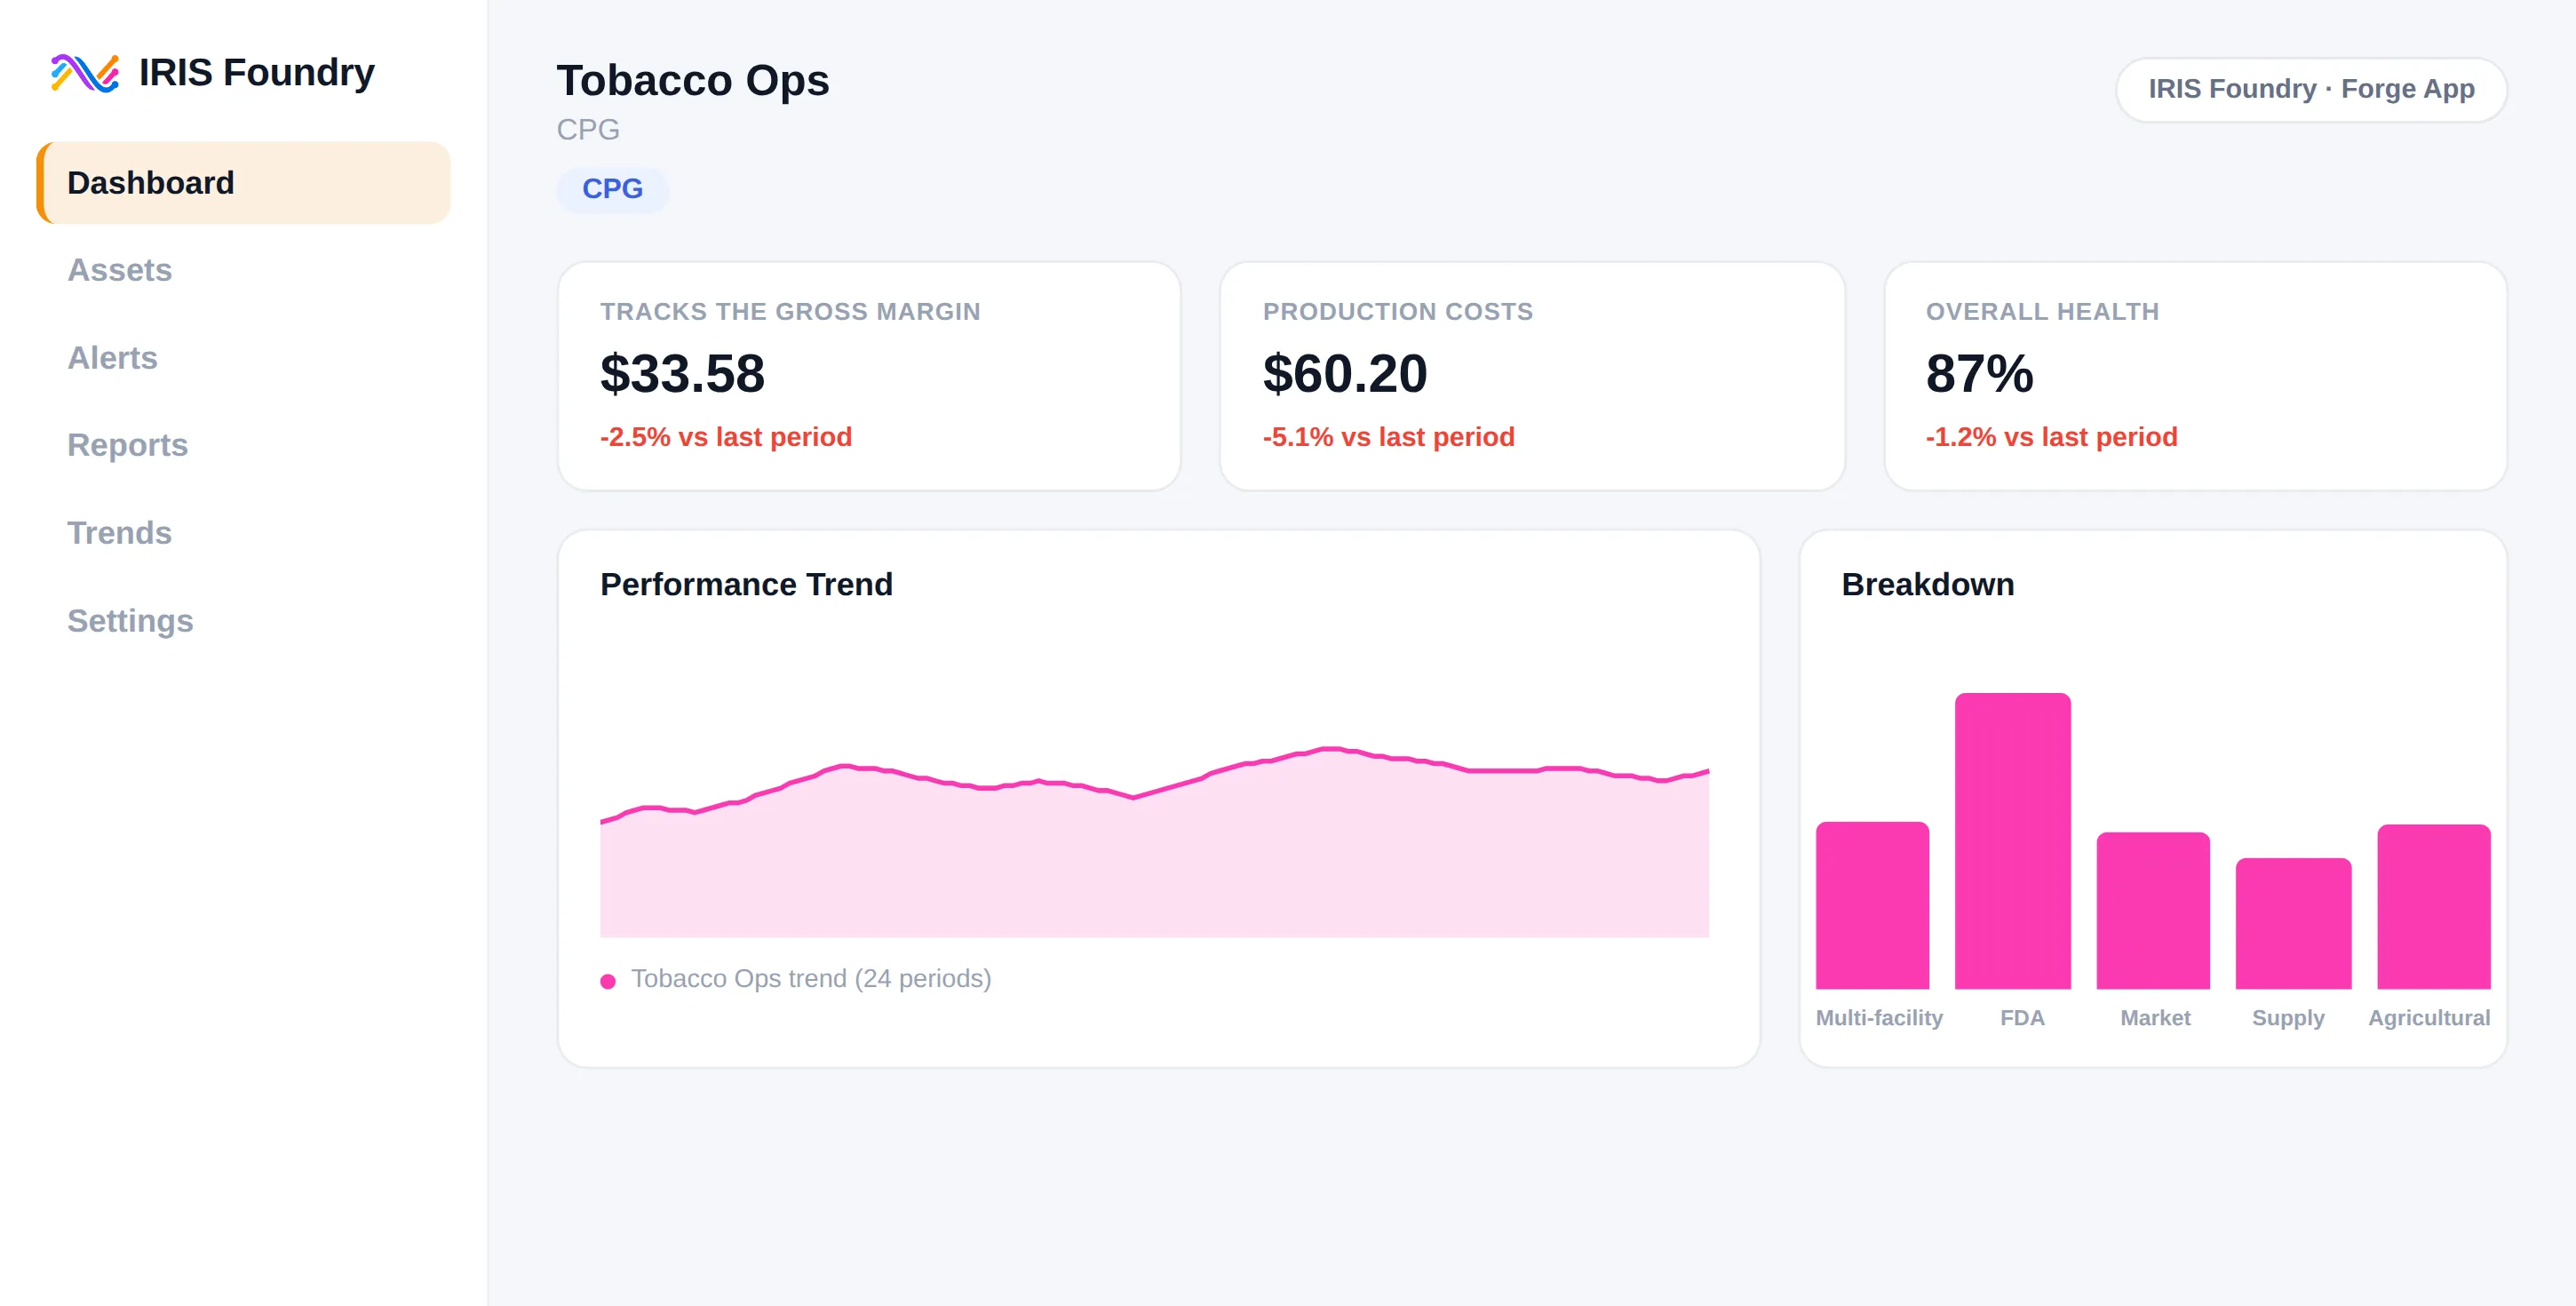
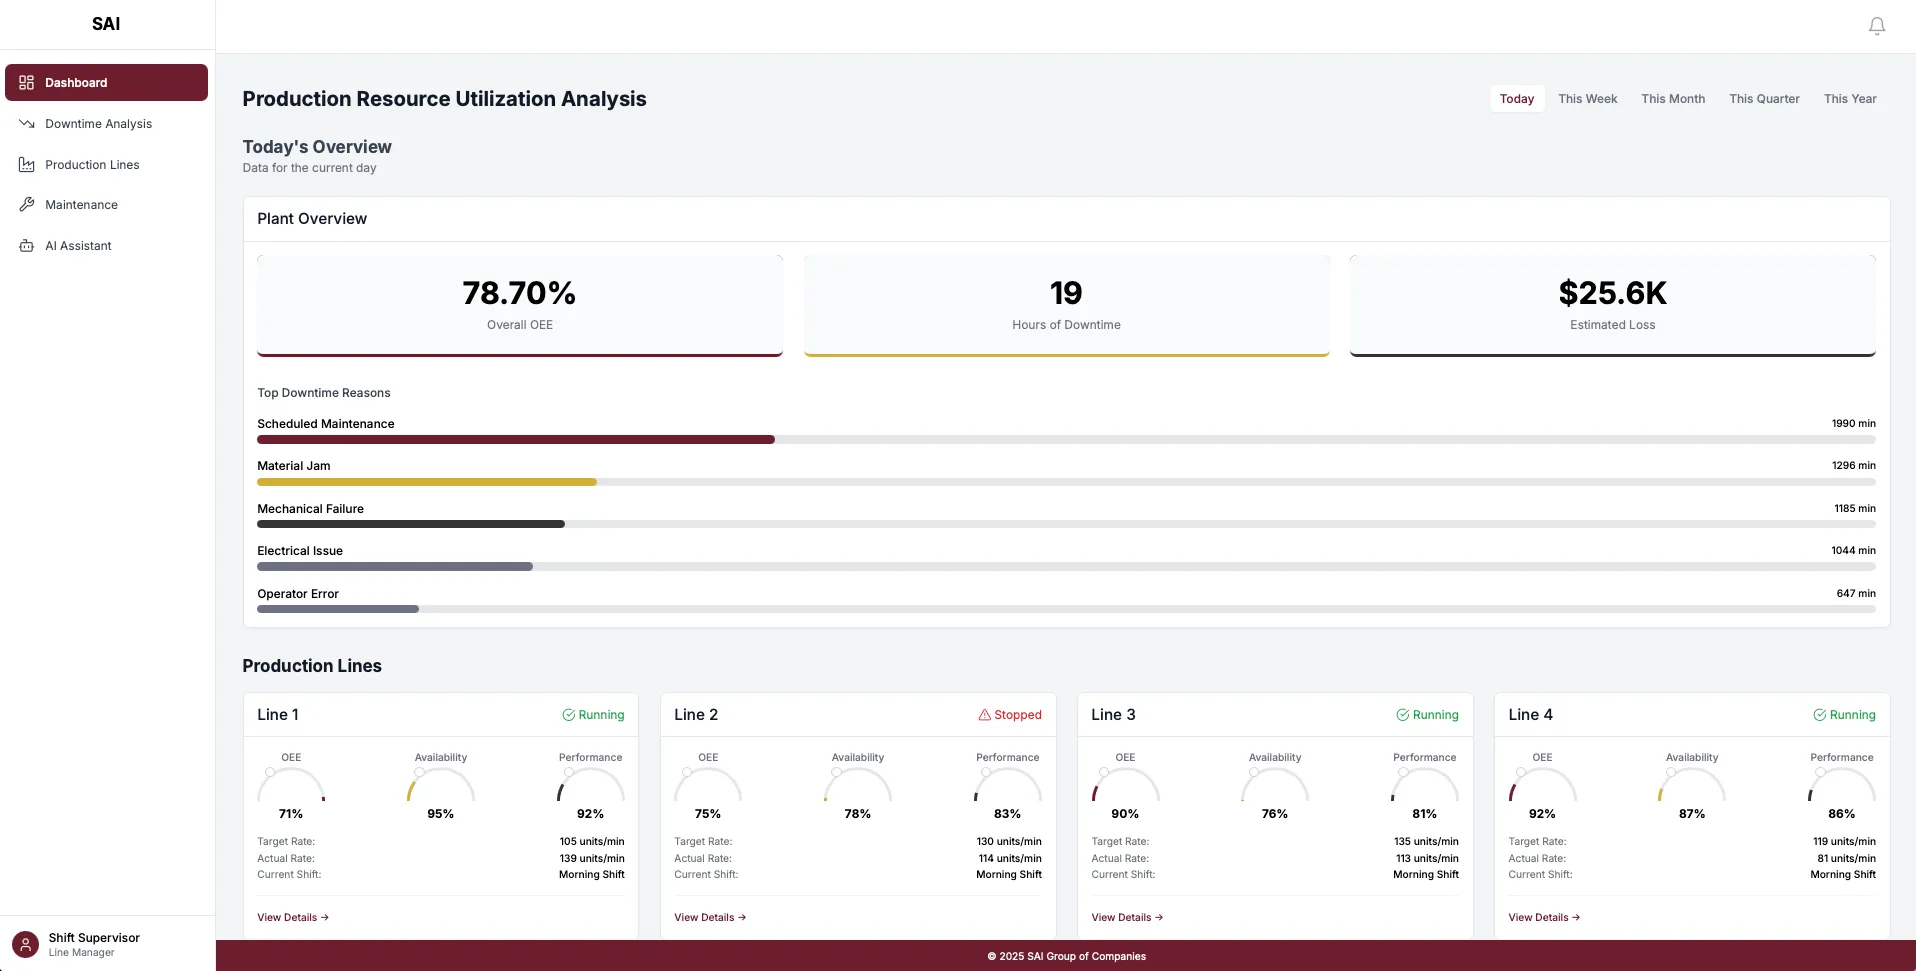
Tobacco Ops
CPG
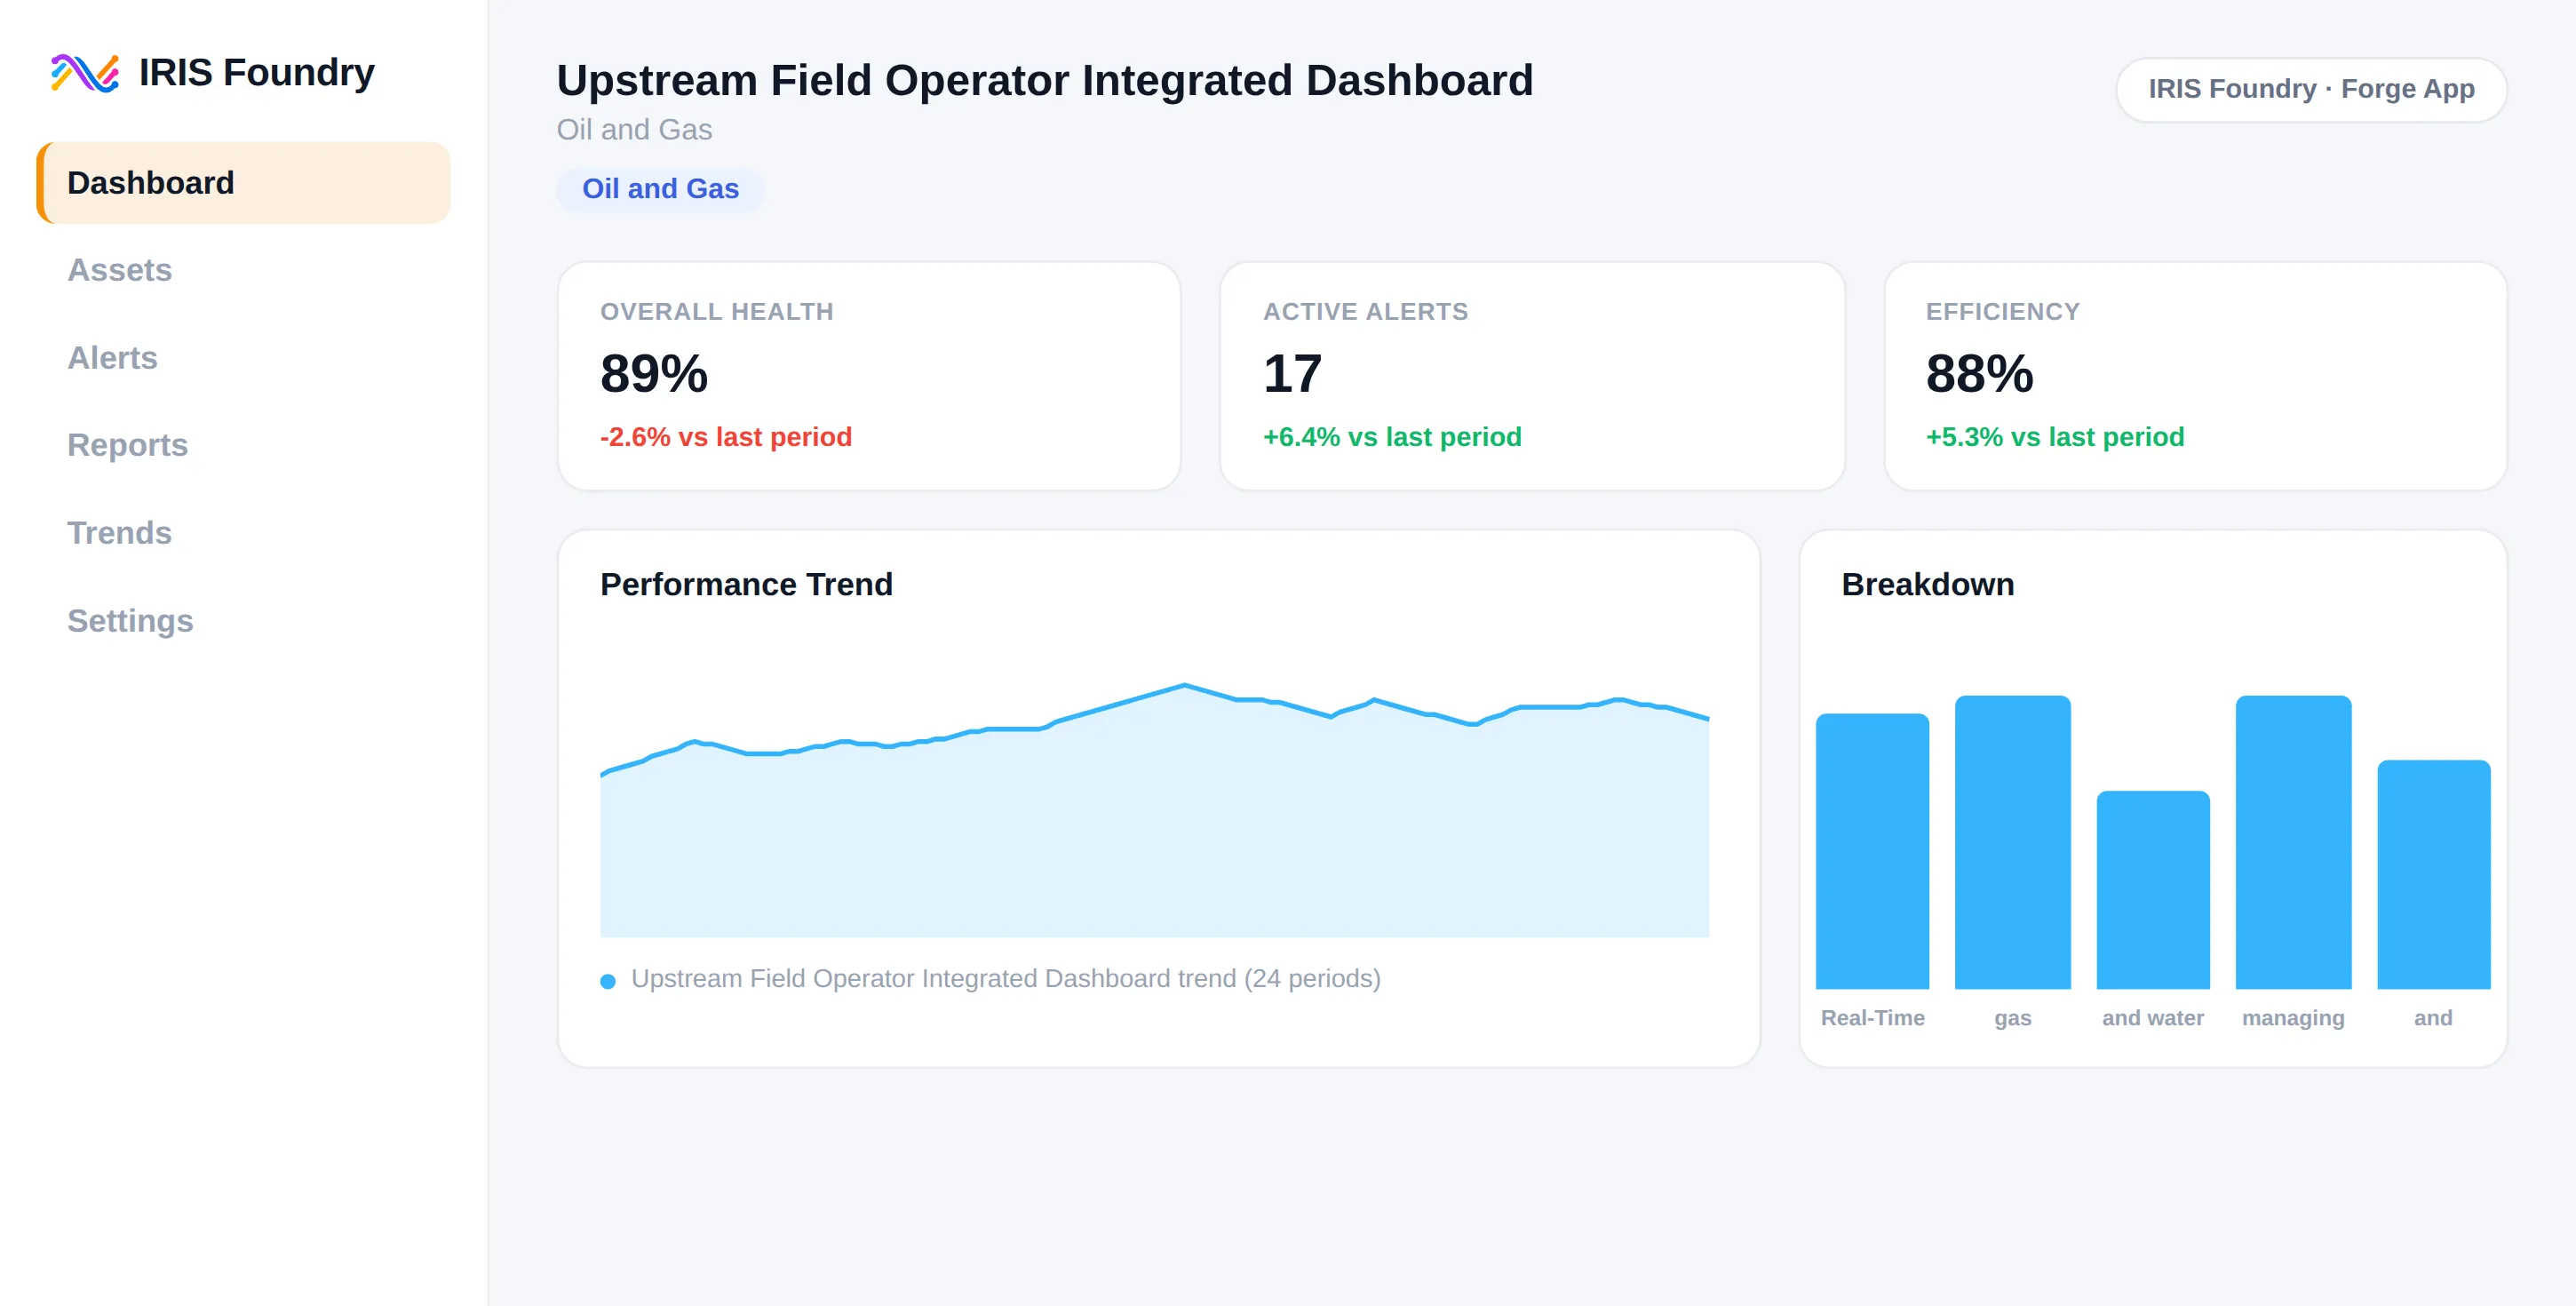
Upstream Field Operator Integrated Dashboard
Oil and Gas
Utilities Ops
Energy
Utilities
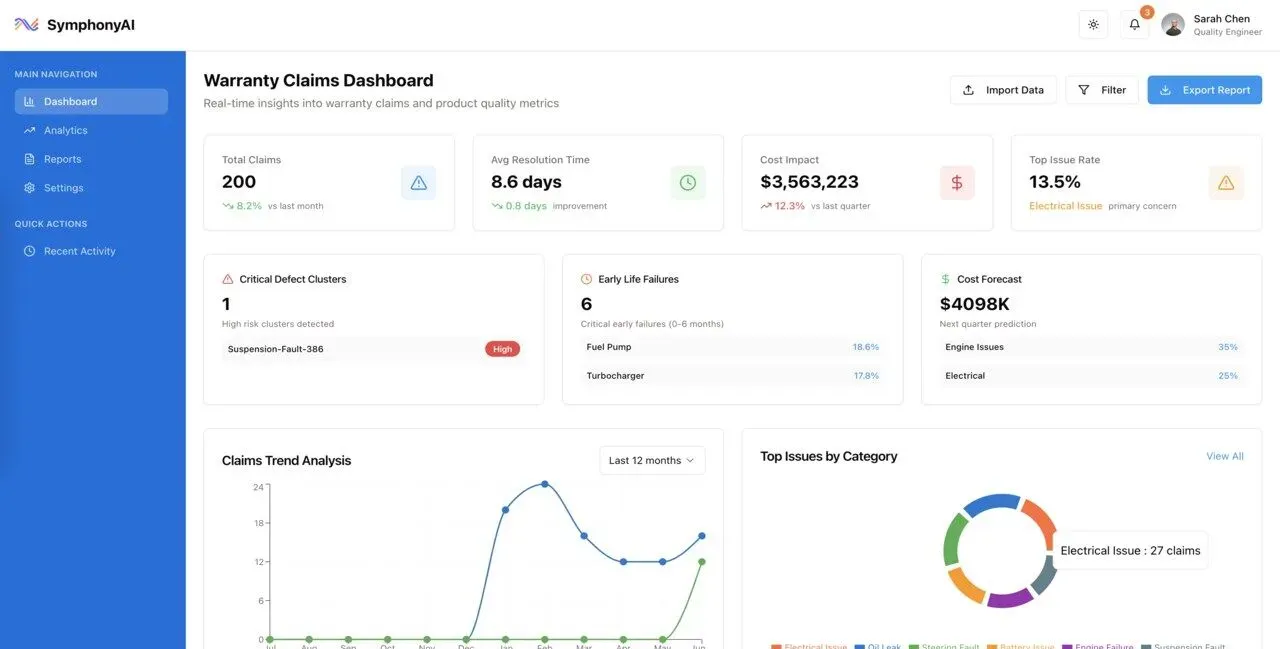
Warranty Claims Agent
Discrete Manufacturing
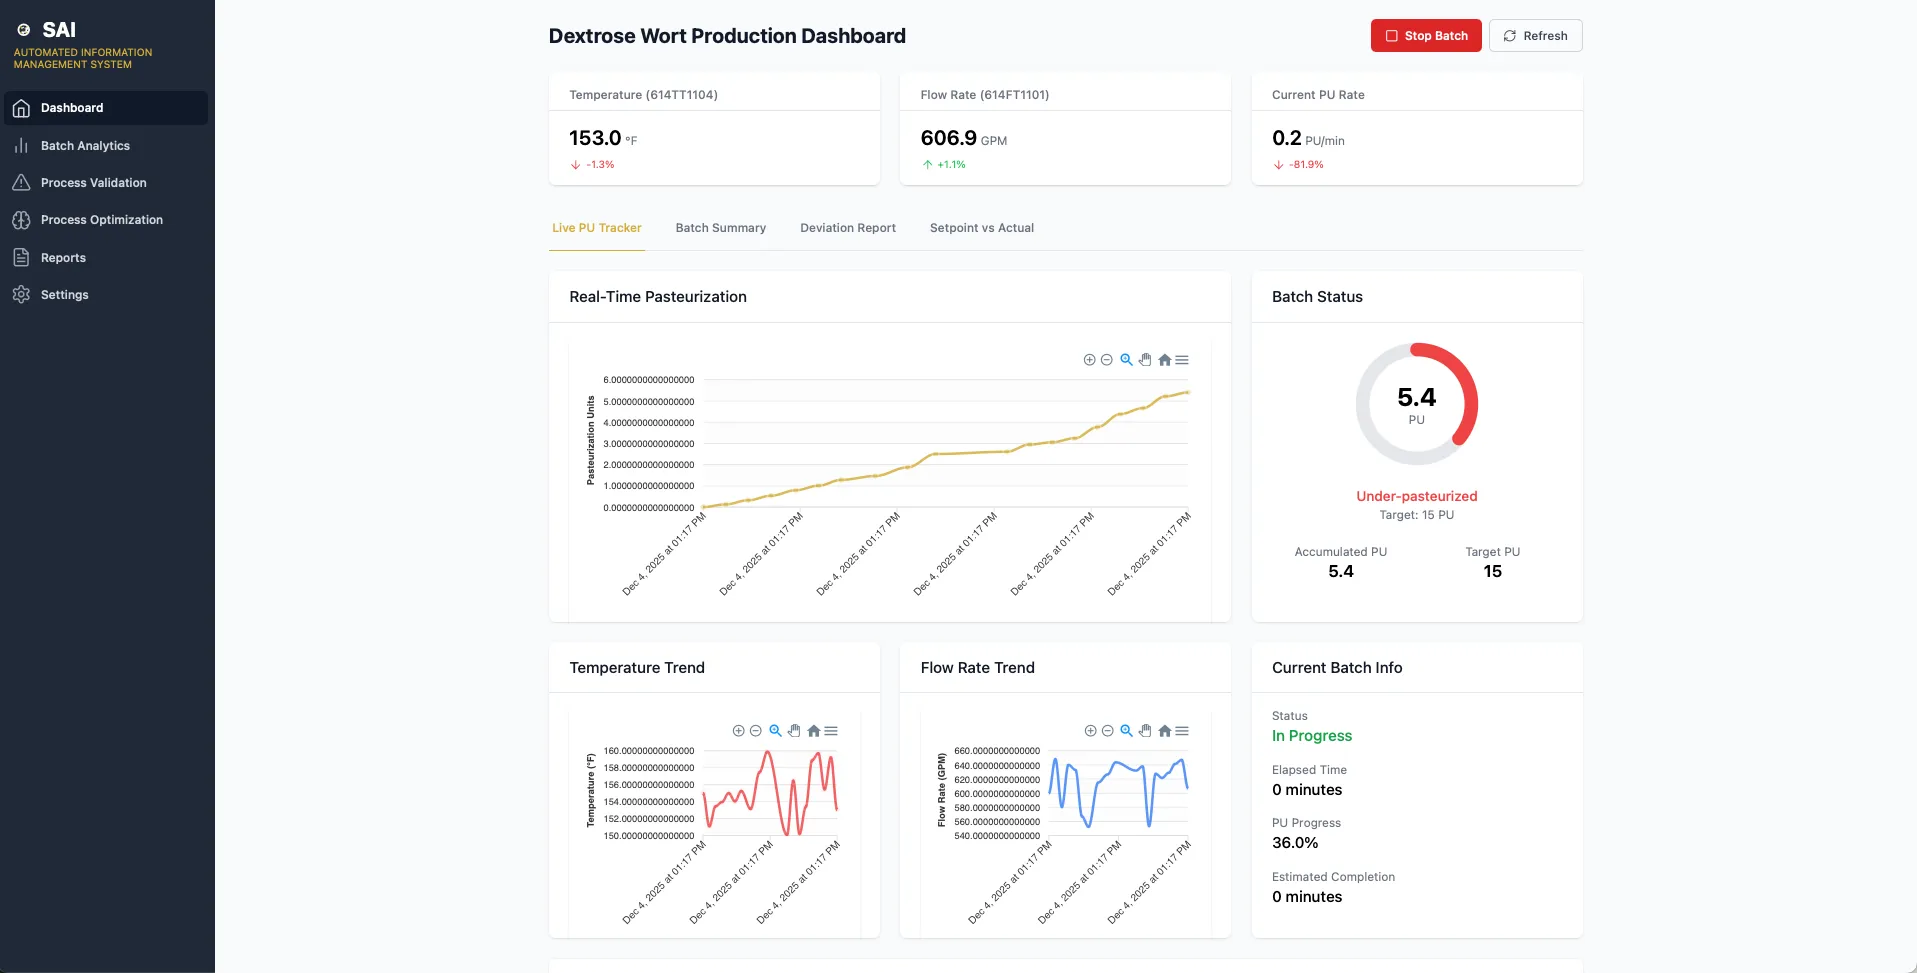
Wort Pasteurization Analysis App
Food and Beverage
CPG