AI-powered Digital Twin

With self-learning neural networks, predictive analytics, and future modeling for enhanced insights and process optimization
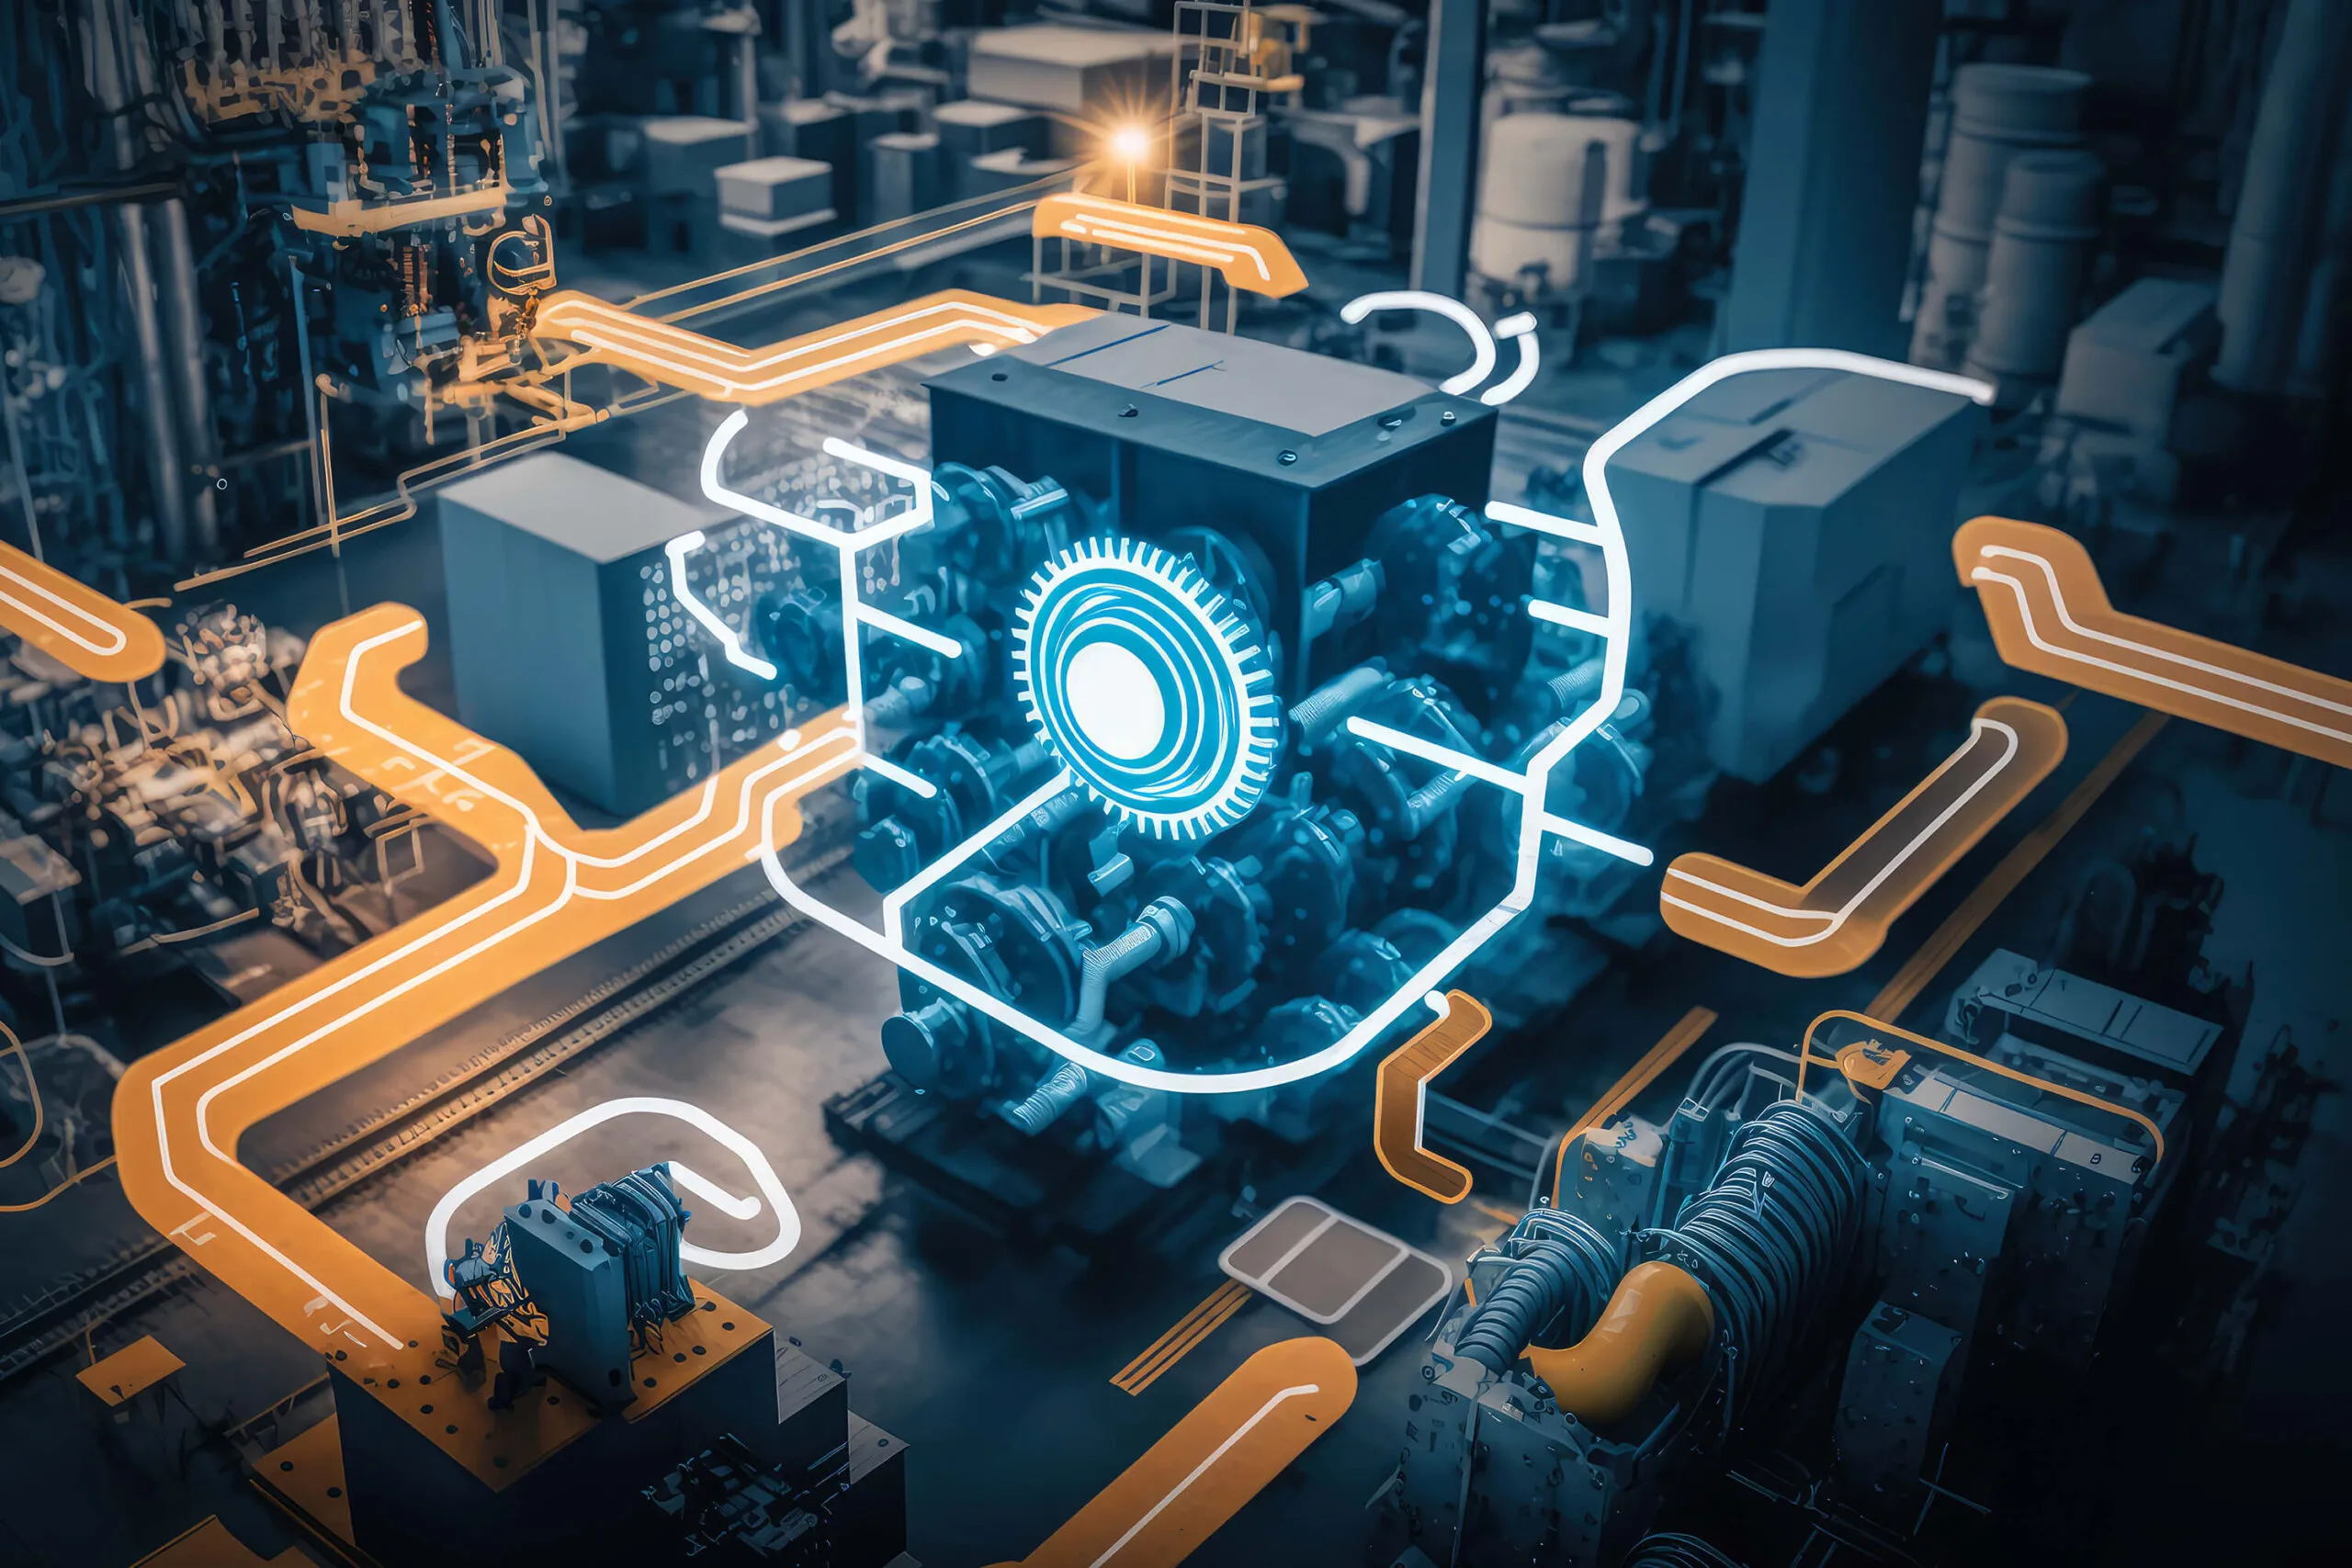
Industrial machinery with digital overlay showing connected circuits and a glowing central gear symbol in a factory setting.

User interface of a Plant Asset Management software displaying a 3D digital twin model of an industrial refinery plant with tanks, pipelines, and processing units in white and pink. The screen shows navigation menus on the left, a top search bar, and a control panel for device status on the bottom right.
Digital Twins: Represent industrial environments with an integrated, real-time operational model

Unify complex industrial data into clear, connected digital twins. Break down silos, simplify deployment, and scale insights across assets to drive efficiency and transformation.

Create accurate virtual replicas of physical objects, assets, and systems

Yellow shield with a white heart in the center, accompanied by a blue padlock on the left, a yellow gear overlapping a blue gear at the bottom center, and a large blue checkmark on the right side.
Improved reliability and availability

Anticipate potential adverse conditions and proactively initiate AI-recommended mitigative actions through digital twins, preventing them from escalating into serious issues.

Blue document icon with three white vertical bar charts and a yellow magnifying glass overlaying the left side of the document.
Data-driven decision making

Enhance your organization’s ability to make data-driven decisions and foster improved transparency and visibility throughout the company.

Illustration of a factory building with a tall chimney and three triangular roof peaks, accompanied by two large gears in front and a yellow swoosh above the factory.
Optimized process
operations

Achieve real-time process optimization through advanced deep learning-based digital twins, generating setpoint advisories. Balance objectives such as cost, throughput, quality, and emissions while employing scenario planning to consistently attain your desired output.

Illustration of a yellow hand holding a large blue check mark and a blue gear above it, symbolizing approval or verified manufacturing process.
Manage risk

By adopting a comprehensive perspective encompassing assets and processes, incorporating real-time health assessments, current process statuses, historical incident data, and future forecasts, we empower confident decision-making, whether it’s on the plant floor or in the boardroom.
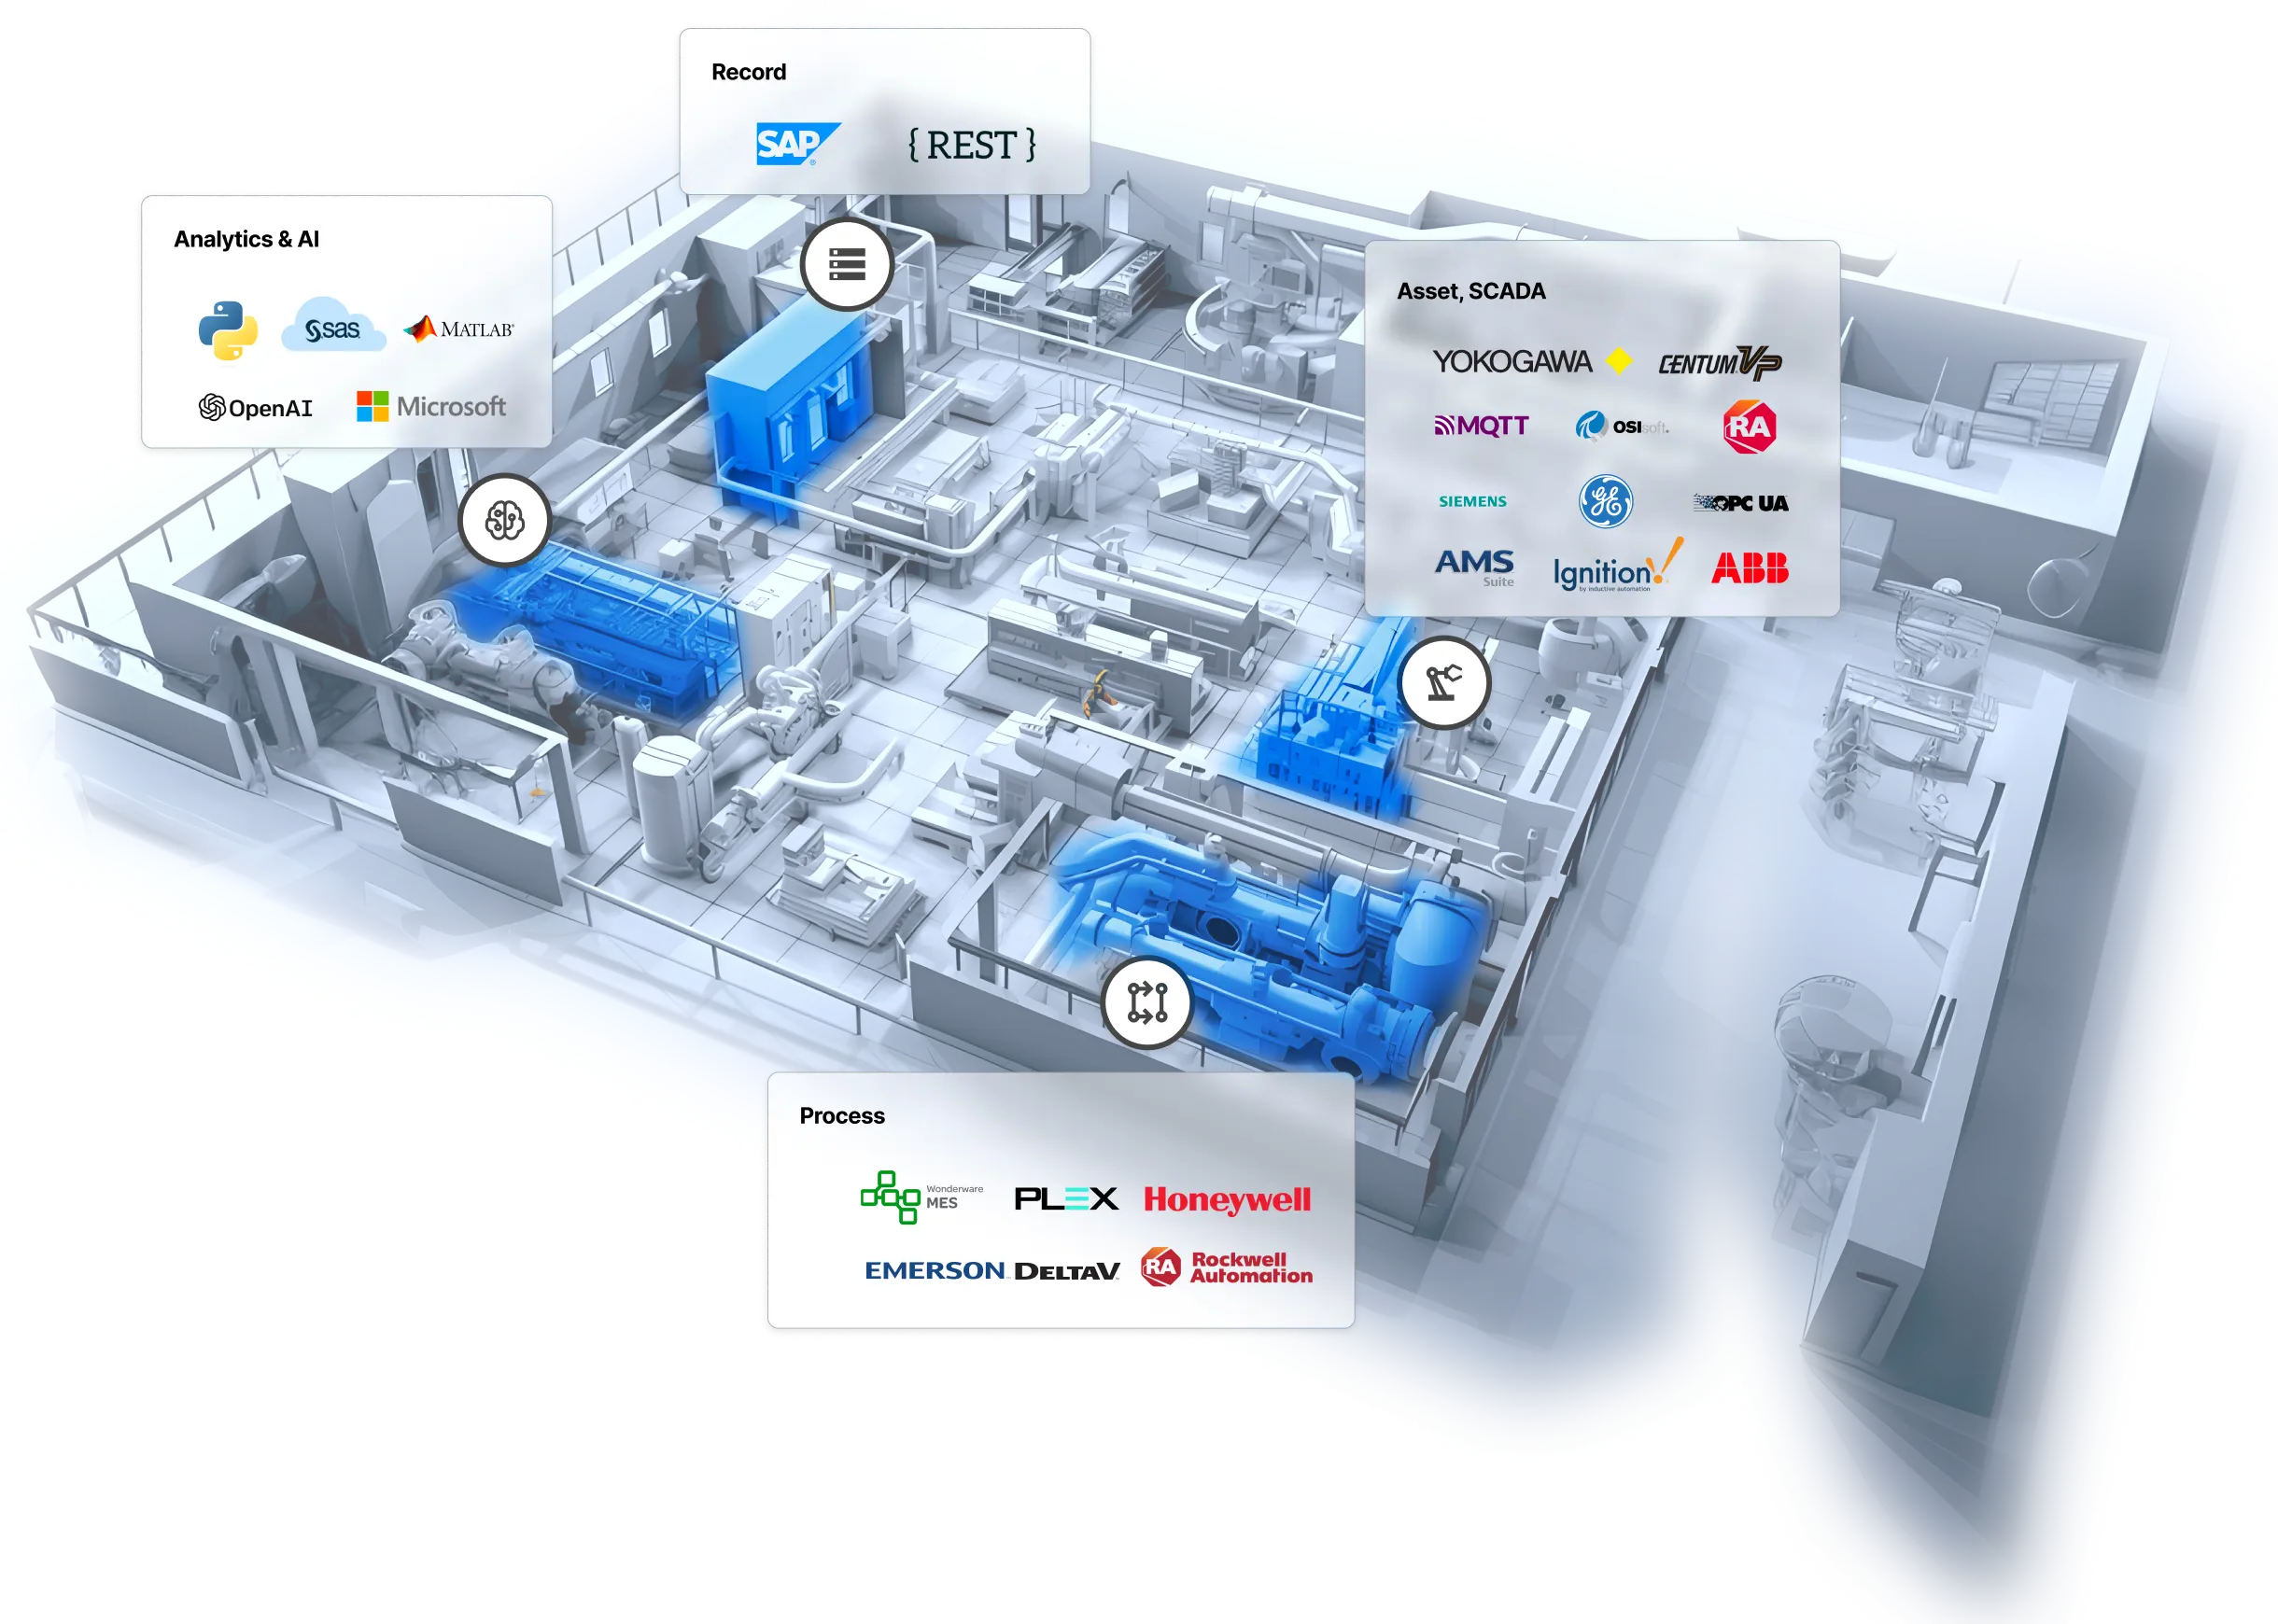
3D factory layout with highlighted industrial machines and production areas, surrounded by labeled software and technology categories including Analytics & AI featuring Python, SAS, MATLAB, OpenAI, Microsoft; Record showing SAP and REST API; Asset, SCADA listing Yokogawa, Centum VP, MQTT, OSIsoft, RA, Siemens, GE, OPC UA, AMS Suite, Ignition, ABB; and Process including Wonderware MES, PLEX, Honeywell, Emerson DeltaV, Rockwell Automation.

Features

Stylized icon of a web browser window in yellow with three circular buttons at the top left and a blue magnifying glass overlaying it on the top right, symbolizing search or inspection.
Connect and contextualize data

Bring data from different sources that have different structures or different time-scales and combine them into a contextualized data fabric using pre-built connectors and asset templates.

Blue document icon with three white vertical bar charts and a yellow magnifying glass overlaying the left side of the document.
Explore and
prepare data

Cleanse, impute, and transform data with no-code exploration and preprocessing tools to prepare the required features for advanced analyses.

Graphic of a web browser window with a factory icon inside, accompanied by a gear symbol and three horizontal lines representing settings or controls.
Experiment with advanced analysis tools

Use no-code interfaces or notebooks to design and run experiments on your data with the latest advancements in MLOps best-practices.

Central vertical yellow line with five yellow circles connected by yellow branches; overlaid with a blue circular trio of arrows pointing counterclockwise.
Deploy and manage model lifecycle

Deploy your models to production, monitor their health, re-train models on a schedule or on-demand, or switch between different models with just a few clicks.

Digital Twin applications
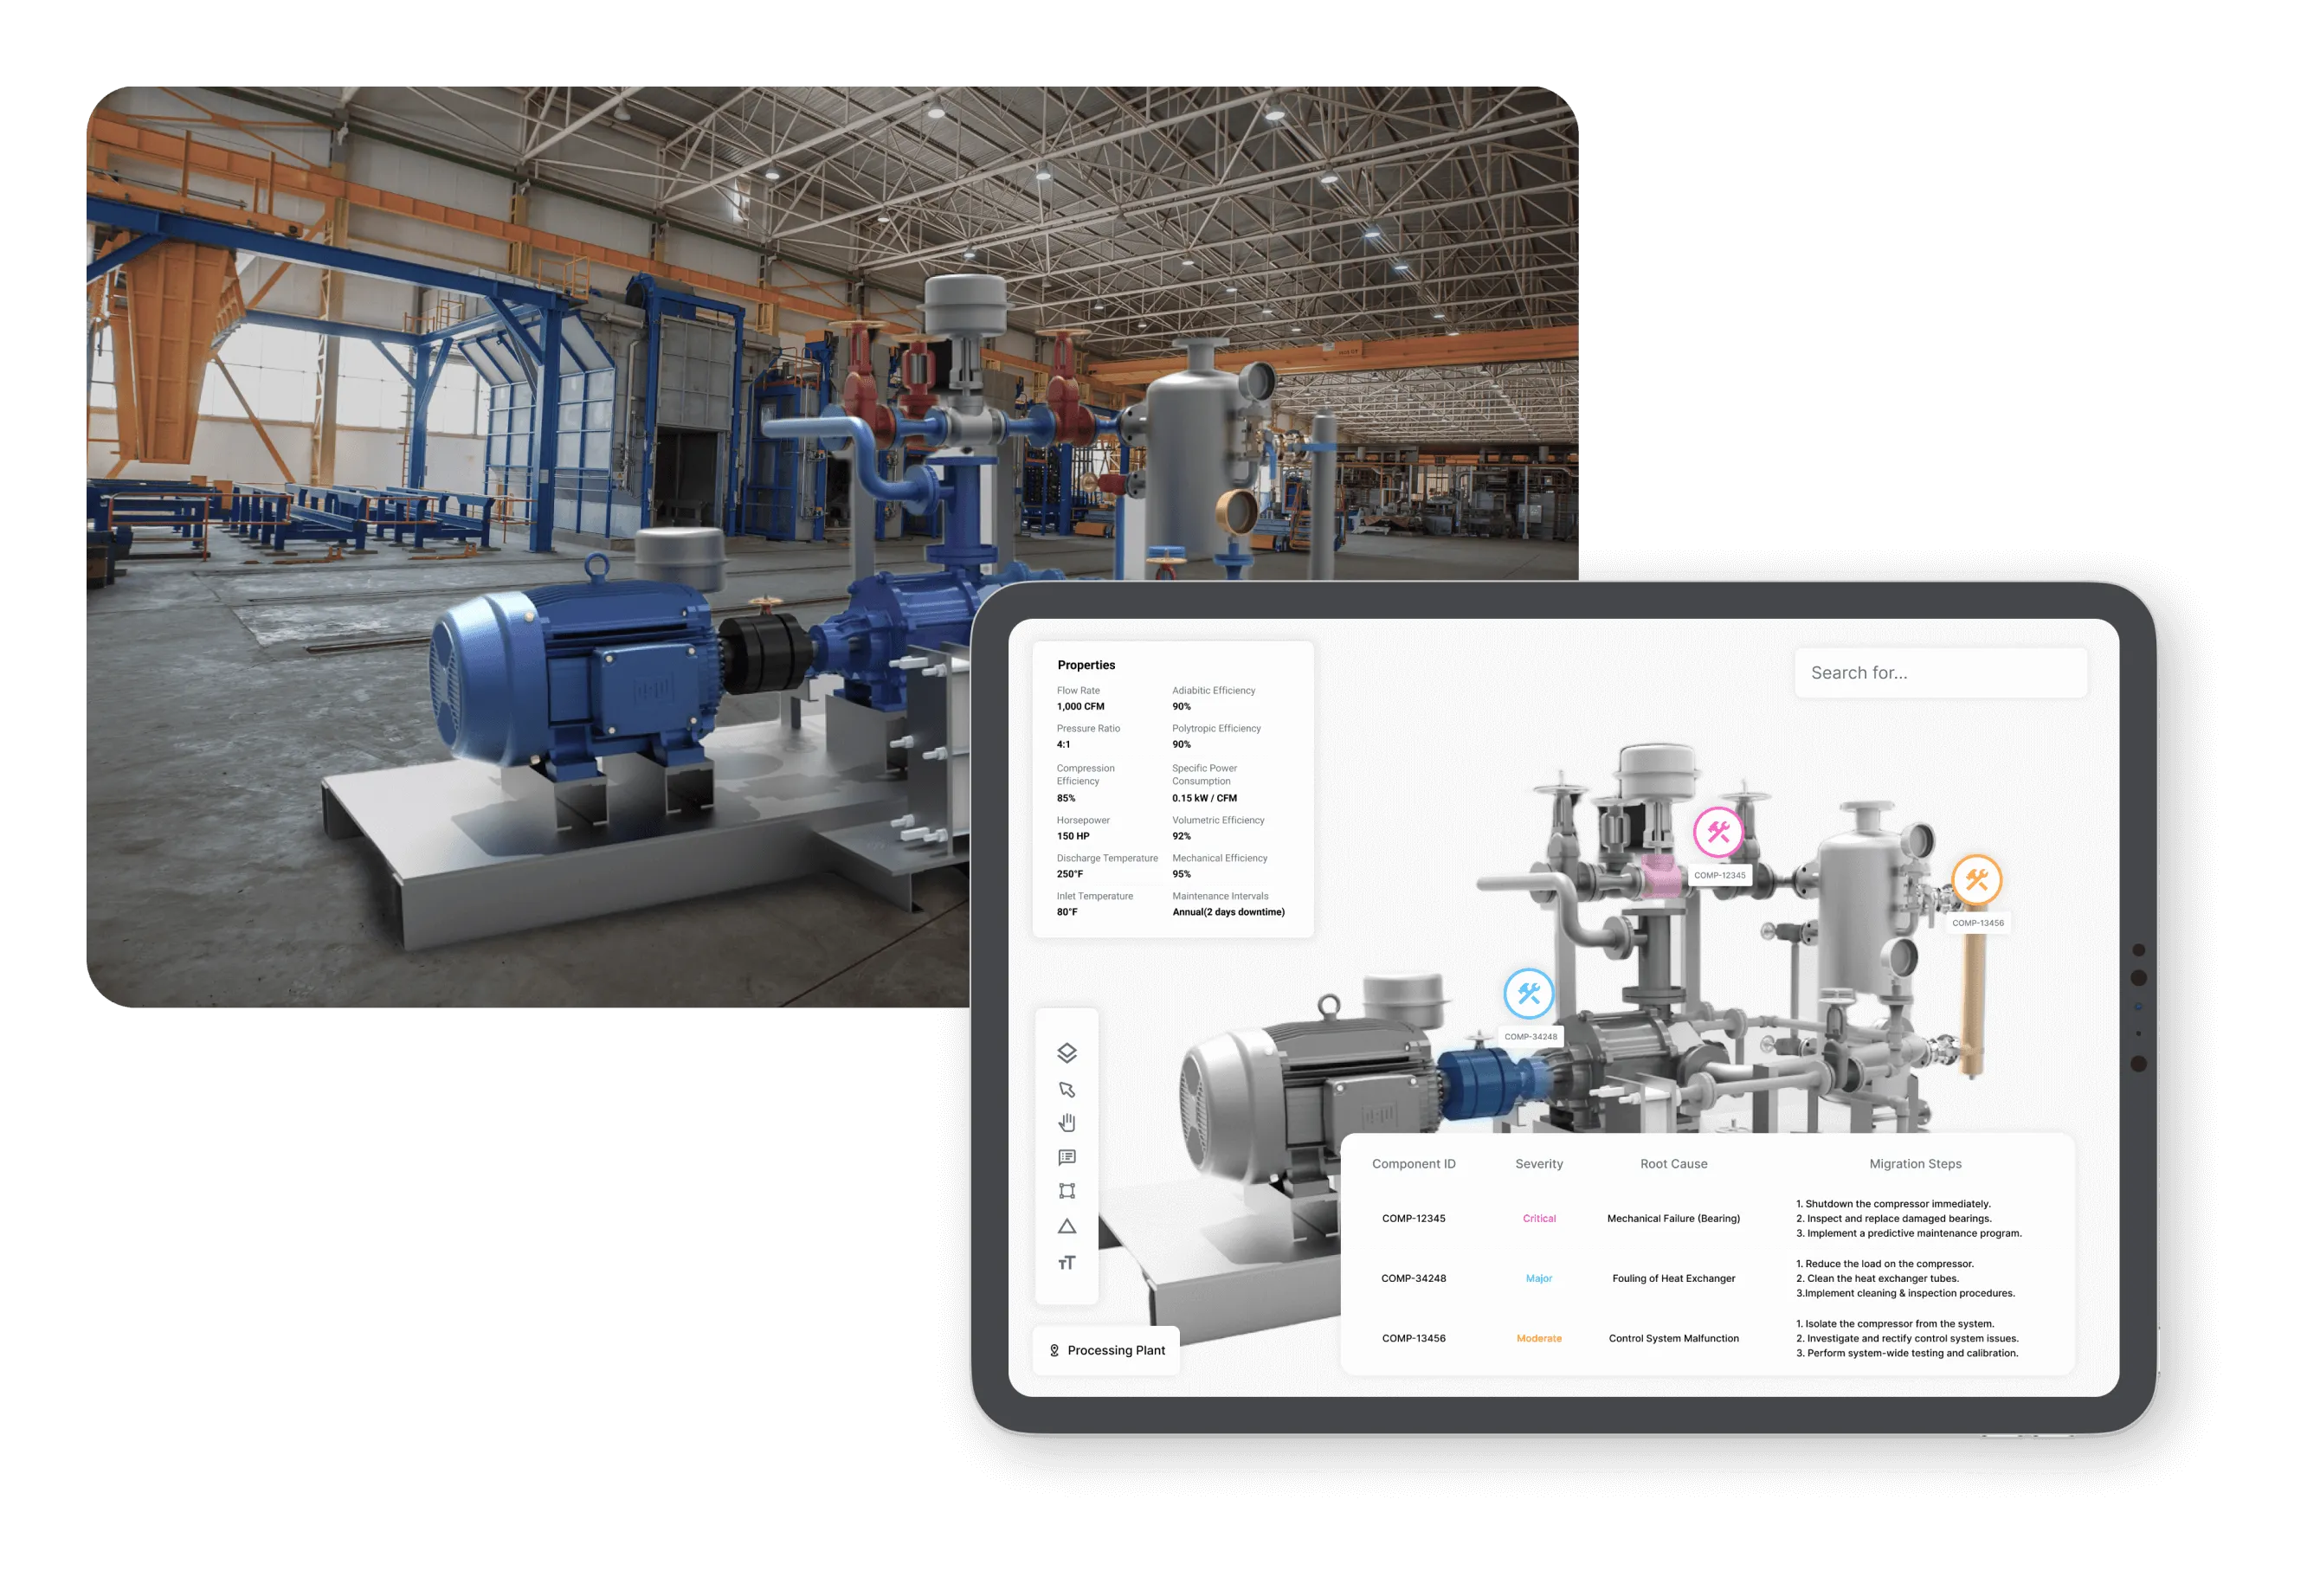
An industrial machine with blue motor and pipes in a large factory space, alongside a tablet screen displaying a 3D digital twin model of the machine with detailed properties, component IDs, severity levels, root causes, and maintenance steps.

A SymphonyAI Digital Twin provides value across the data analytics journey – from soft-sensing to data imputation, from component-level early-warning systems to process-level, real-time system optimization. SymphonyAI solutions such as APM 360 and Performance 360 use digital twins as the primary way to assess asset health and risk.

Manufacturers save millions of dollars annually in unrealized downtime, maintenance, energy, and scrappage costs across industries, including oil and gas, power, mining, metals, food and beverage, pharmaceuticals, and semiconductors.

Seamless expansion and accelerated growth of your digital twin with the out-of-the-box Digital Twin Studio

All of your data and asset Management, scaling, and governance needs in a single location. Our centralized control center empowers you to effortlessly deploy, manage, monitor, and govern a wide range of production models, regardless of their origin or deployment points.
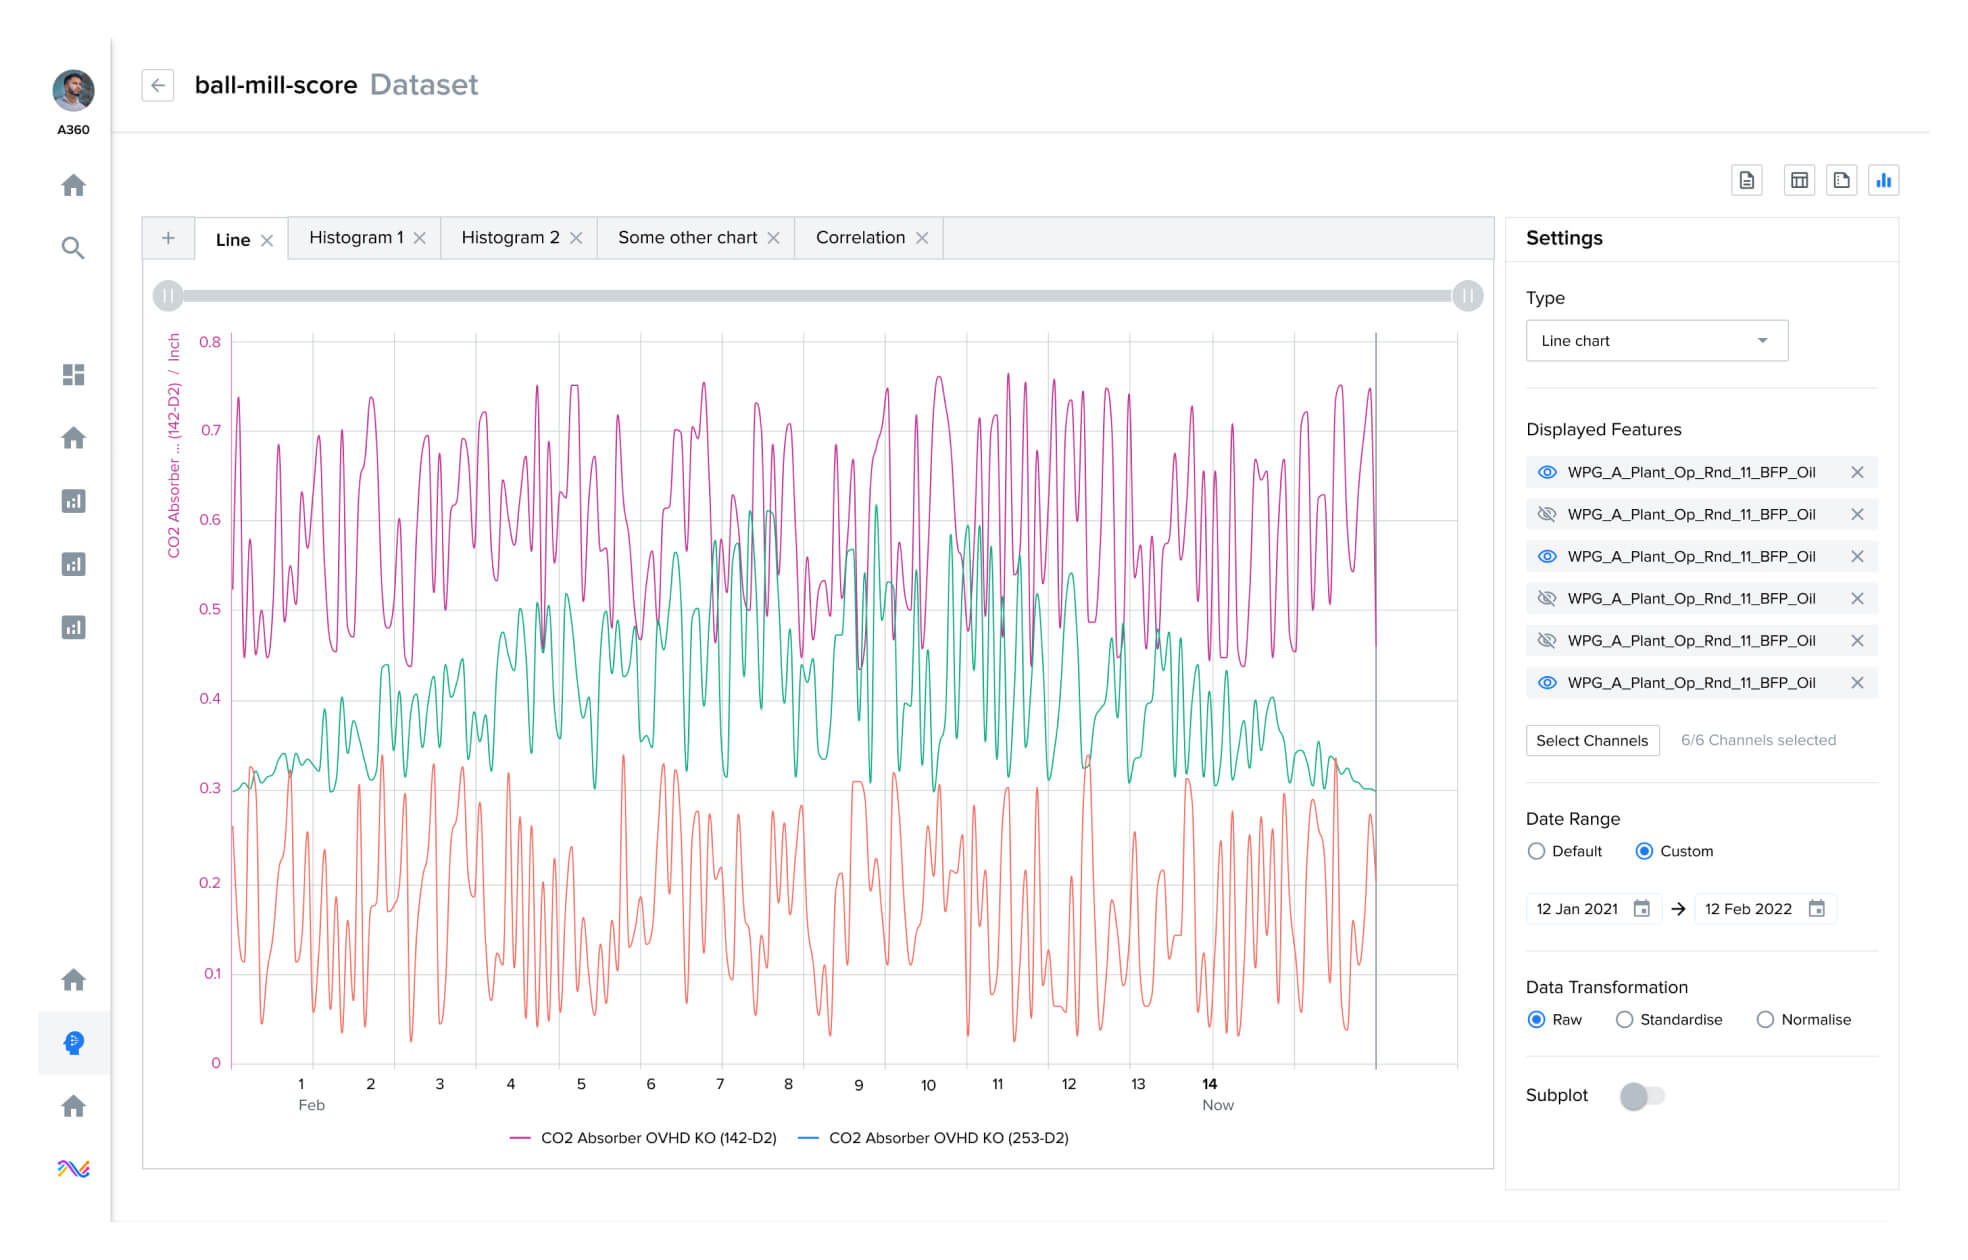
A data analysis dashboard showing a line chart tracking CO2 Absorber OVHD KO levels over time from February 1 to mid-February with three fluctuating colored lines in pink, teal, and red. The pink line has higher values around 0.4 to 0.8 inches, the teal line is mid-range, and the red line is lower. The chart includes tabs for Line, Histogram 1, Histogram 2, Some other chart, and Correlation. A sidebar on the right displays settings including chart type as line chart, displayed features with repeated names, date range from January 12, 2021 to February 12, 2022, data transformation options with Raw selected, and a subplot toggle off. The interface has a left sidebar with icons and a user avatar labeled A360.

Data Exploration

With its user-friendly, no-code interface, the Digital Twin Studio allows its users to visually explore data, create interactive charts, filter data with mathematical expressions, identify trends and outliers with statistics and machine learning, and extract insights without programming expertise. 
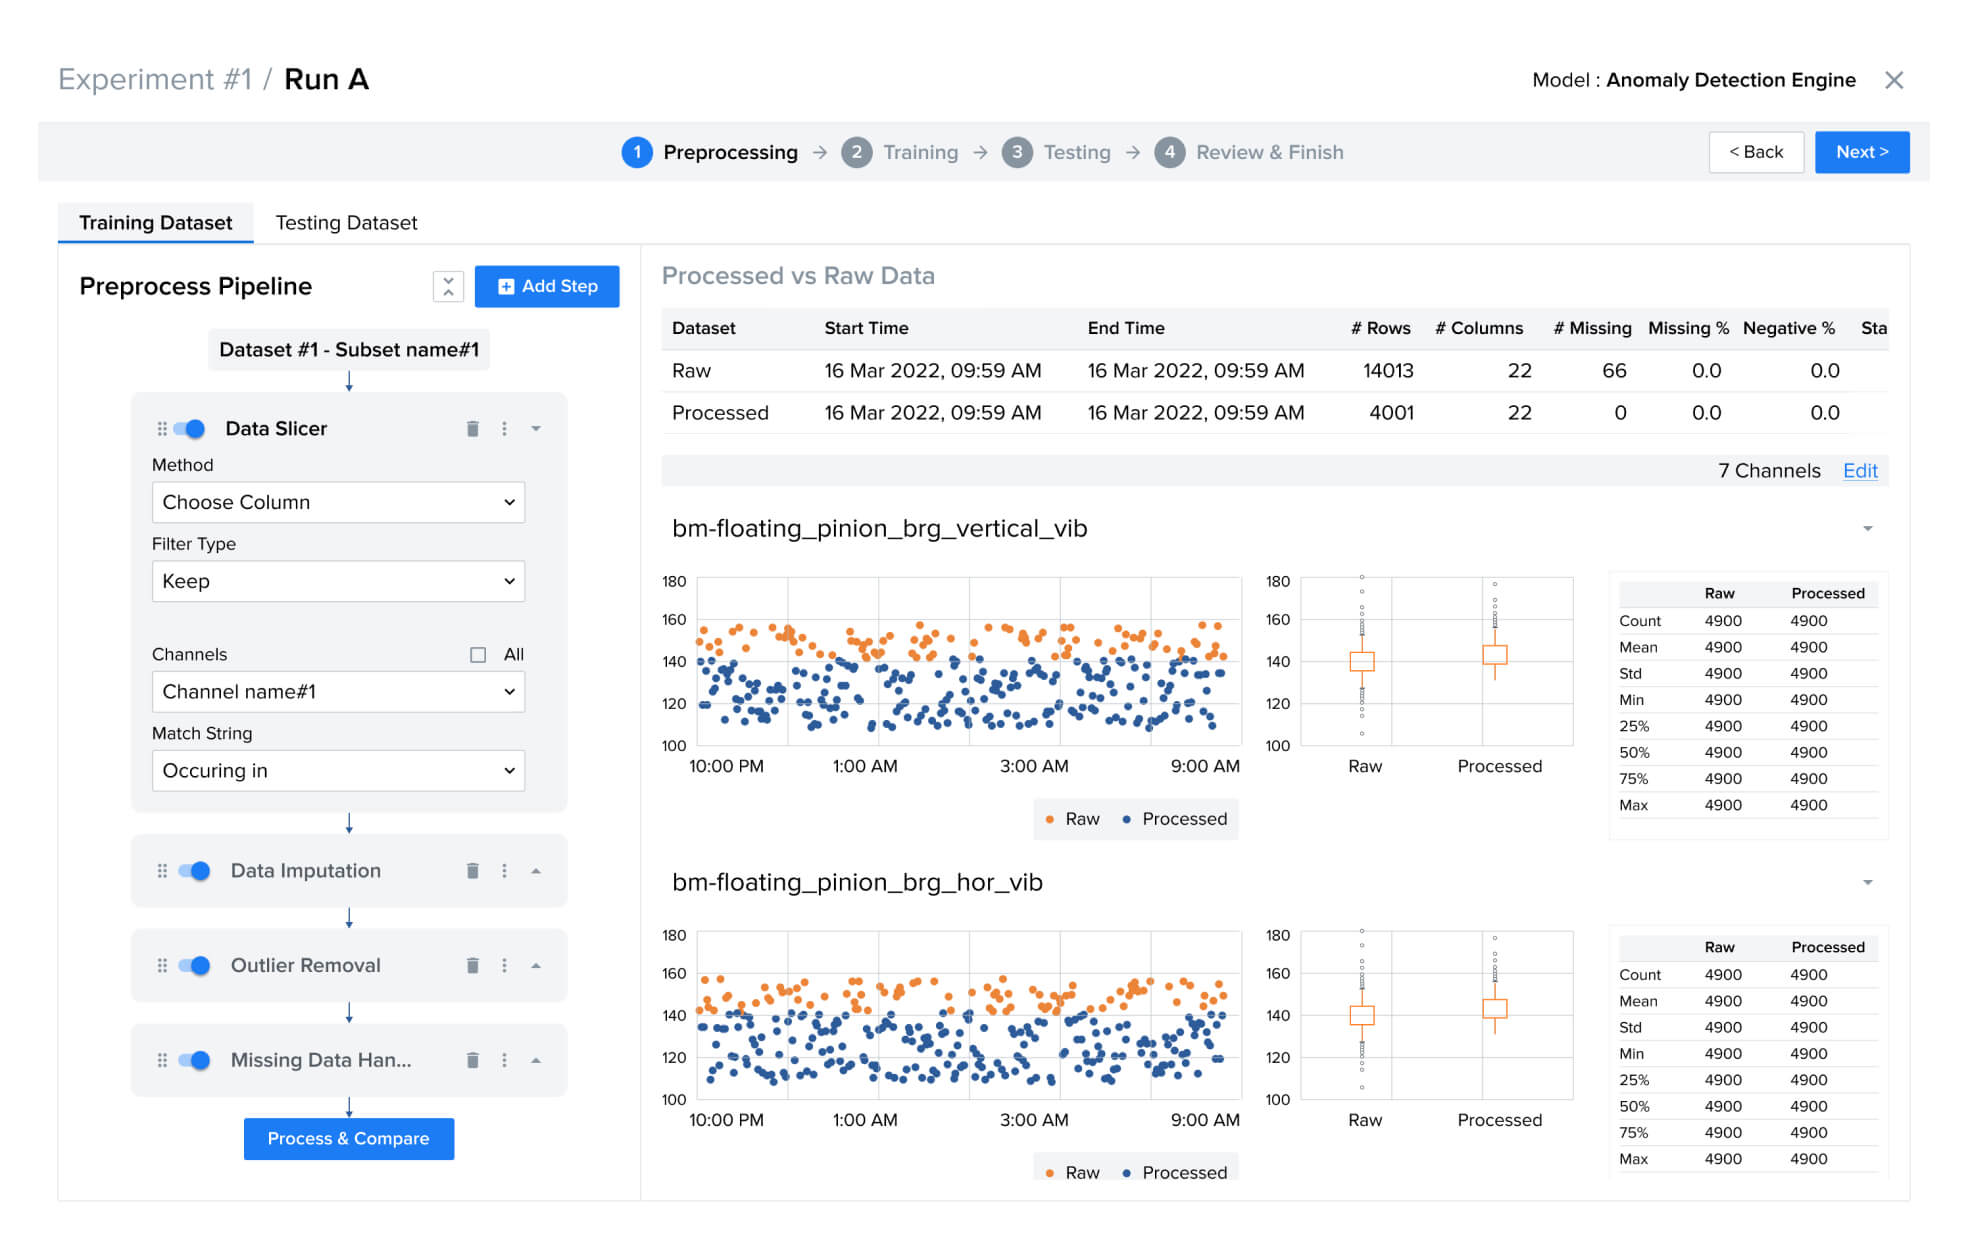
Screenshot of a data preprocessing interface for anomaly detection showing steps including Data Slicer, Data Imputation, Outlier Removal, and Missing Data Handling in a pipeline. The right side compares raw and processed datasets from March 16, 2022, with row counts, columns, and missing data statistics. Two graphs visualize vibration data for bm-floating_pinoin_brg_vertical_vib and bm-floating_pinoin_brg_hor_vib, each depicting raw data points in orange and processed data points in blue over time, accompanied by box plots and summary statistics tables for raw and processed data.

Data pre-processing

The Digital Twin Studio simplifies the often complex data preparation task. Its no-code tools help users clean industrial data and generate the required features for downstream analysis. Users can handle missing values, standardize formats, and perform feature engineering without writing a single line of code, ensuring that AI models start with the best-quality data.
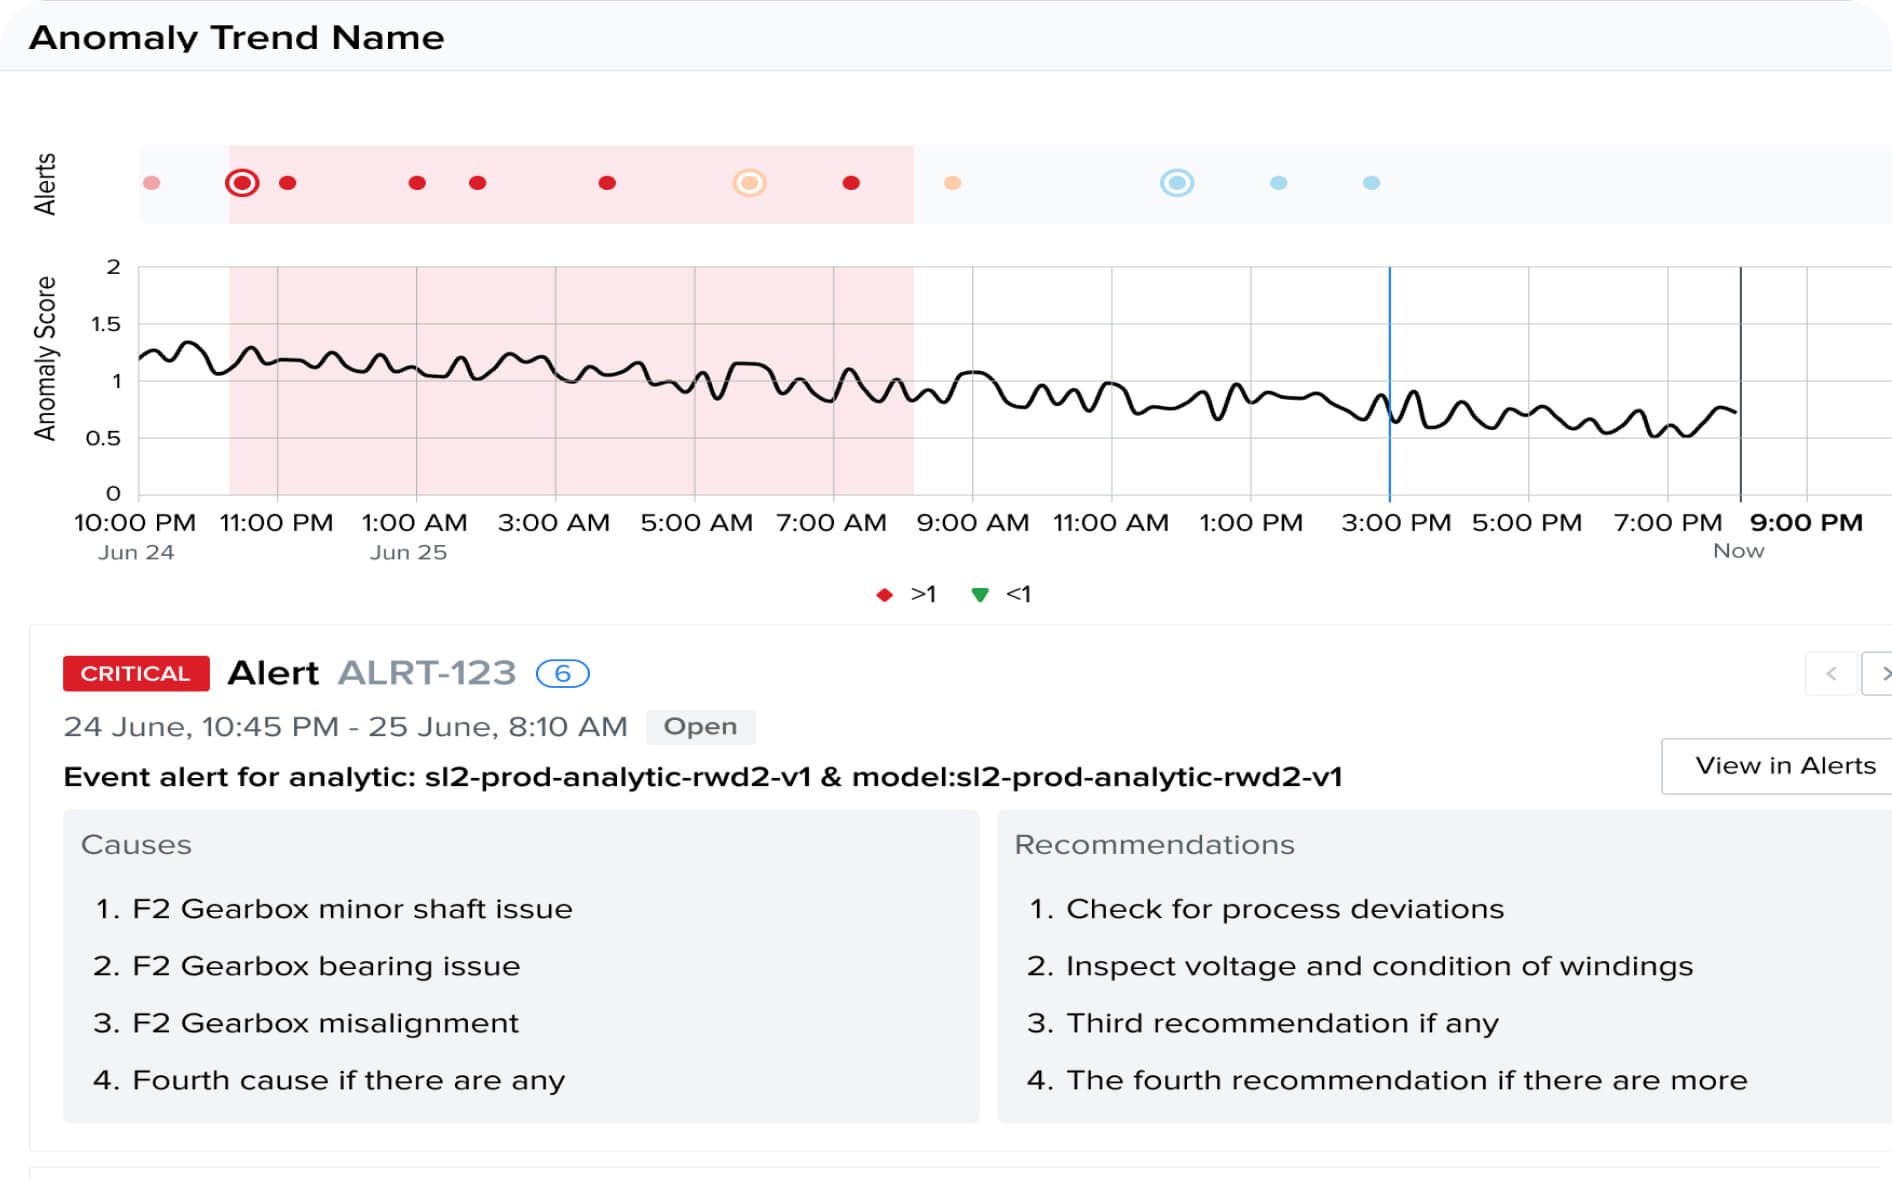
Line graph titled 'Anomaly Trend Name' showing anomaly scores over time from 10 PM June 24 to 9 PM June 25, with colored dots representing alerts: red for critical alerts before 9 AM and blue for others after. Below, a critical alert ALRT-123 from June 24, 10:45 PM to June 25, 8:10 AM is detailed, listing causes including F2 Gearbox issues and recommendations to check process deviations and inspect voltage and windings.

Model evaluation

Digital Twin Studio empowers users to train and score AI models effortlessly with its intuitive, no-code interface. Users can easily configure training parameters, select algorithms, and fine-tune model performance without the need for code or complicated infrastructure setup. They can score models against industrial data to measure accuracy and ensure models deliver precise predictive and prescriptive insights for data-driven decision-making.
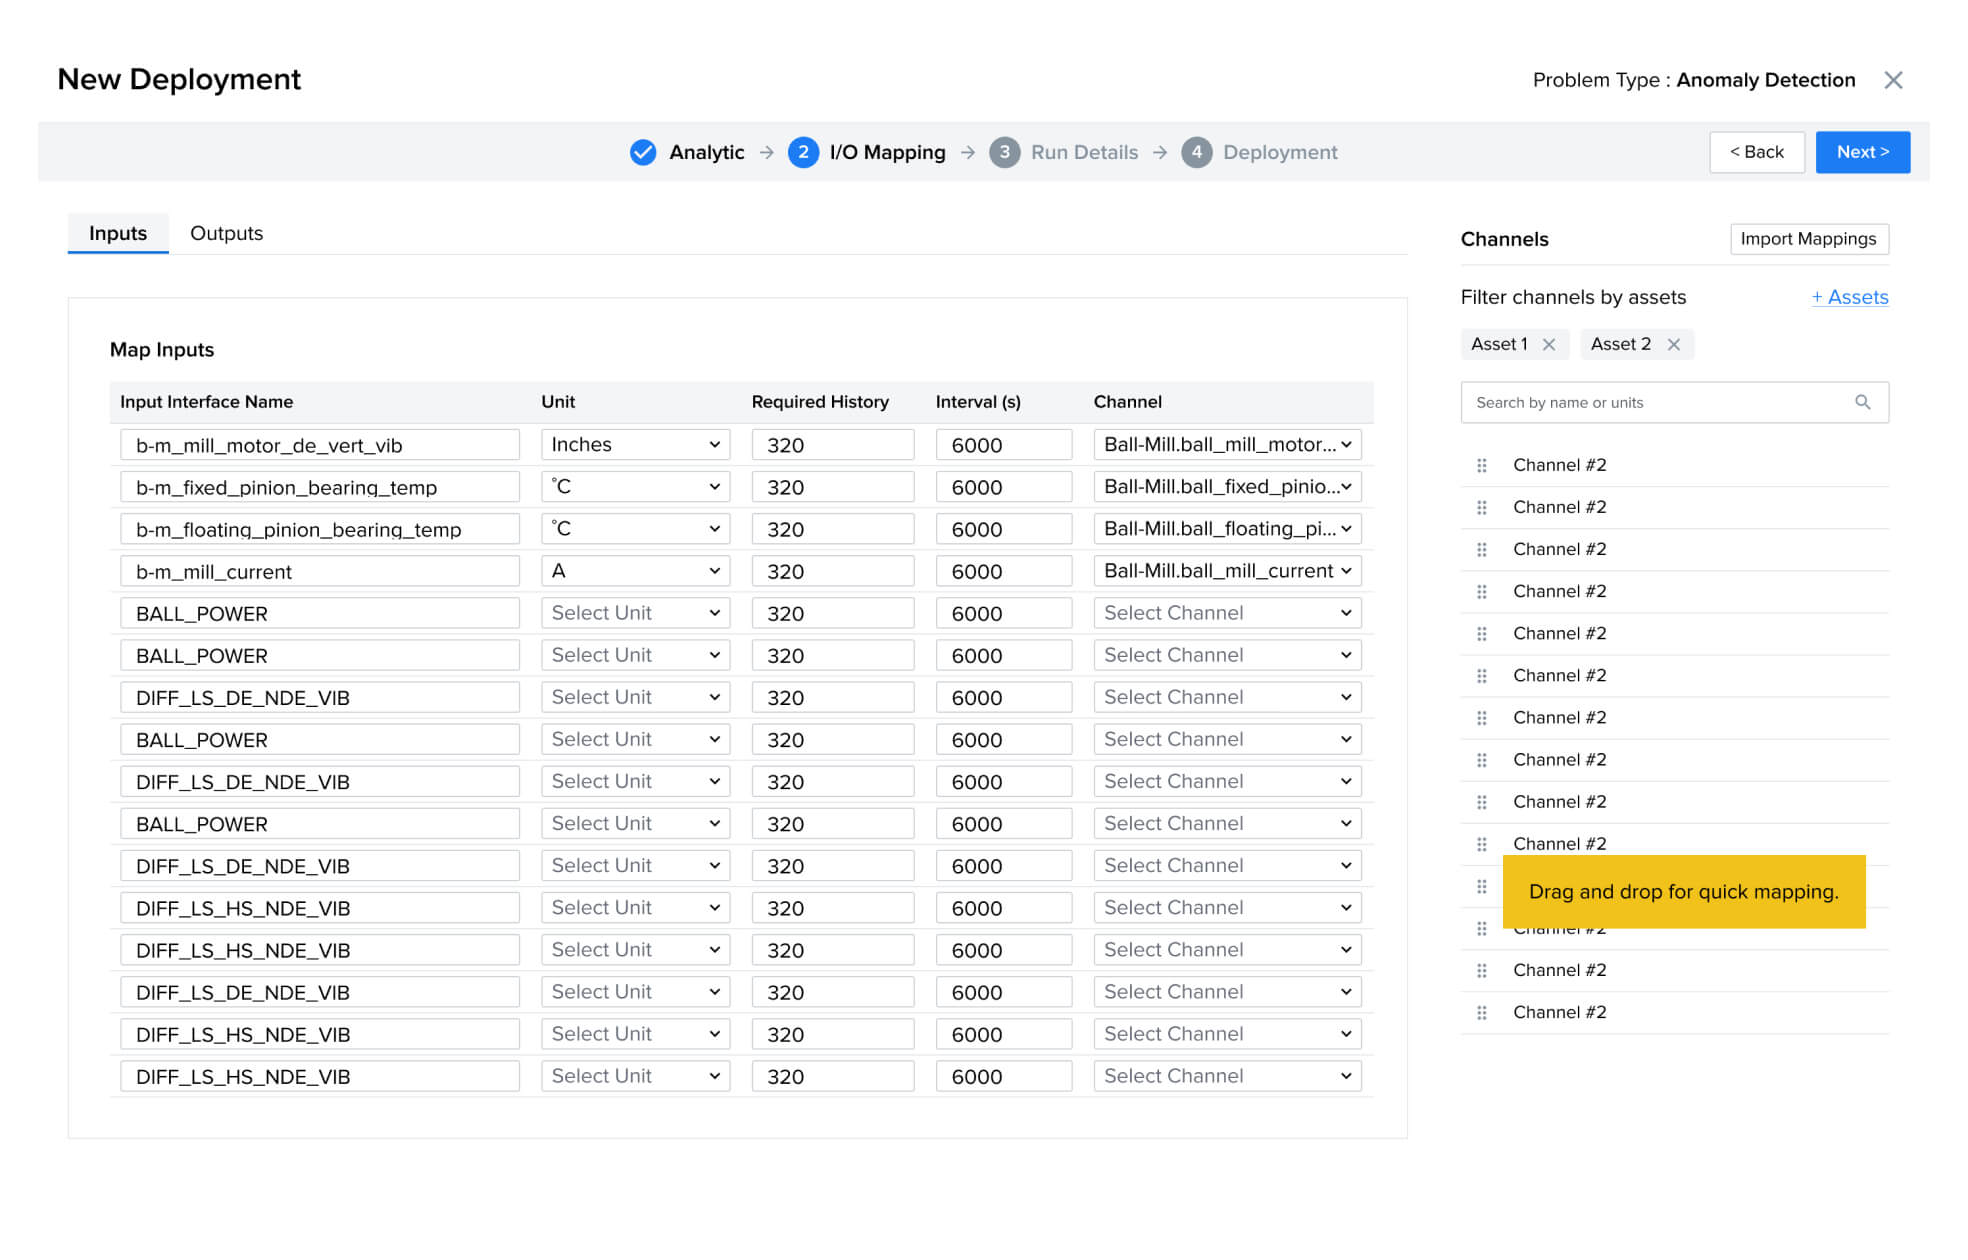
User interface for new deployment setup in anomaly detection showing inputs tab with map inputs table; columns include Input Interface Name, Unit, Required History, Interval (s), and Channel with several entries filled and many set to select unit and channel. On right, channels filtered by assets with options and drag-and-drop quick mapping tip in yellow highlight. Navigation at top indicates step 2 of 4: I/O Mapping.

Model deployment

Transitioning from AI-model development to real-world applications is seamless with Digital Twin Studio. Its no-code deployment options facilitate integration into industrial systems, making it easy to implement models. Users can monitor performance, update models as needed, and ensure the organization benefits from timely, accurate insights for informed decision-making.

Data modeling
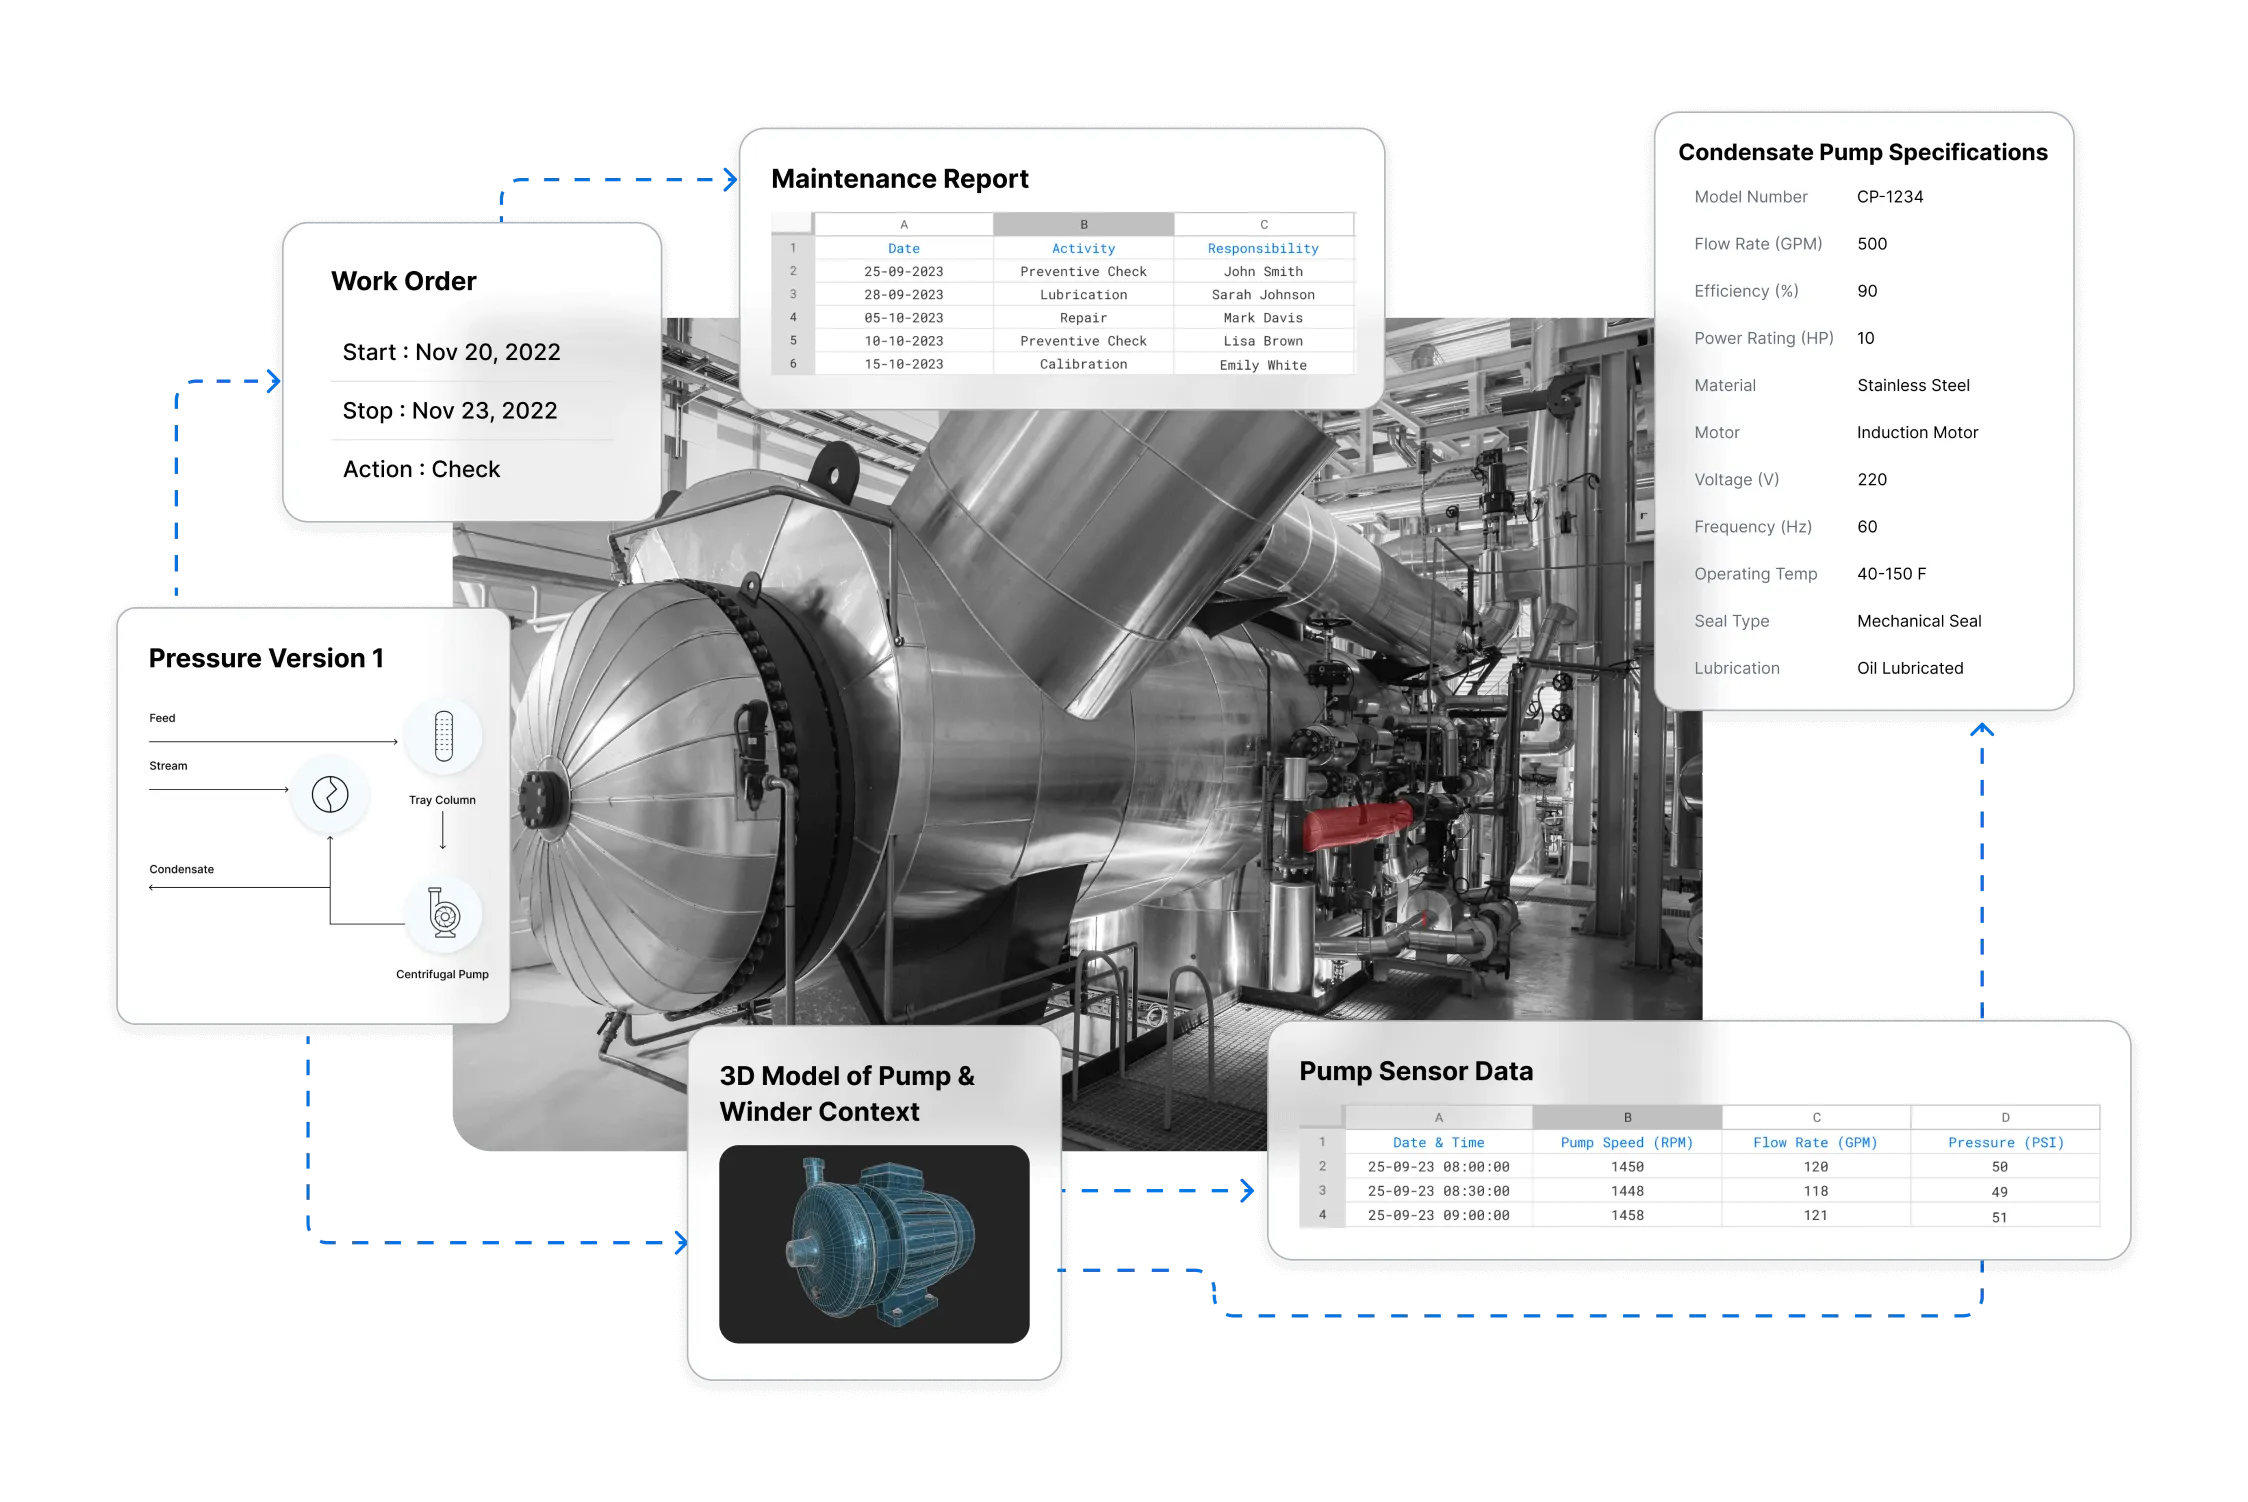
Industrial pump setup in a factory surrounded by data tables and diagrams: a work order listing start and stop dates and action; a maintenance report showing dates, activities, and responsible persons; condensate pump specifications including model number, flow rate, efficiency, and other details; a pressure version 1 diagram showing feed, stream, tray column, and centrifugal pump; a 3D model of a pump and winder; and a pump sensor data table with date and time, pump speed, flow rate, and pressure.

Preview the Digital Twin Studio

Recognition

Frost & Sullivan company name in white serif text on a blue rectangular background.
Frost & Sullivan – 2023 Best Practices Award
The word Verdantix in dark blue stylized uppercase letters with an oversized V at the start.
Verdantix Green Quadrant

Knowledge Graph

Quickly discover patterns and insights across billions of data points deeply and efficiently.