< Back
Quality Management Ops
Automate quality assurance with AI that watches process variables continuously, inspects parts with computer vision, and flags issues before defects reach the customer.
Overview
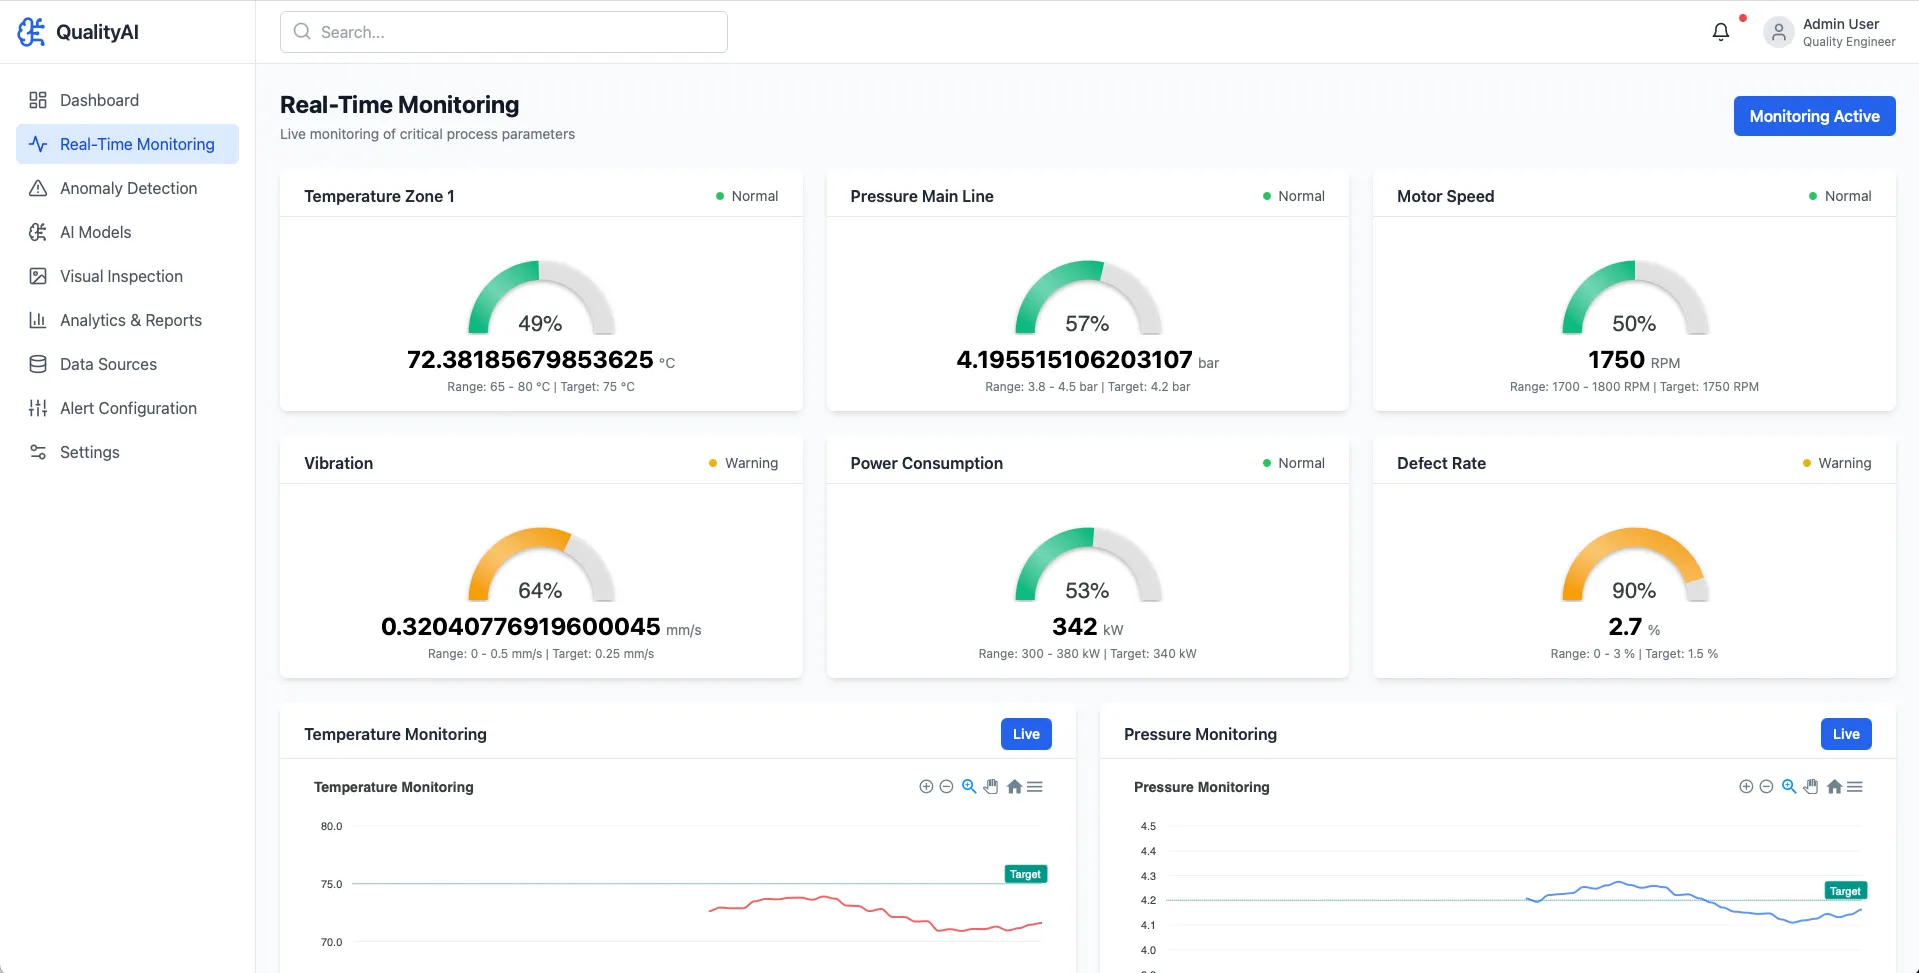
Quality Management Ops is an industrial AI application that automates and optimizes manufacturing quality assurance through real-time data integration. It is the quality nerve center for production facilities.
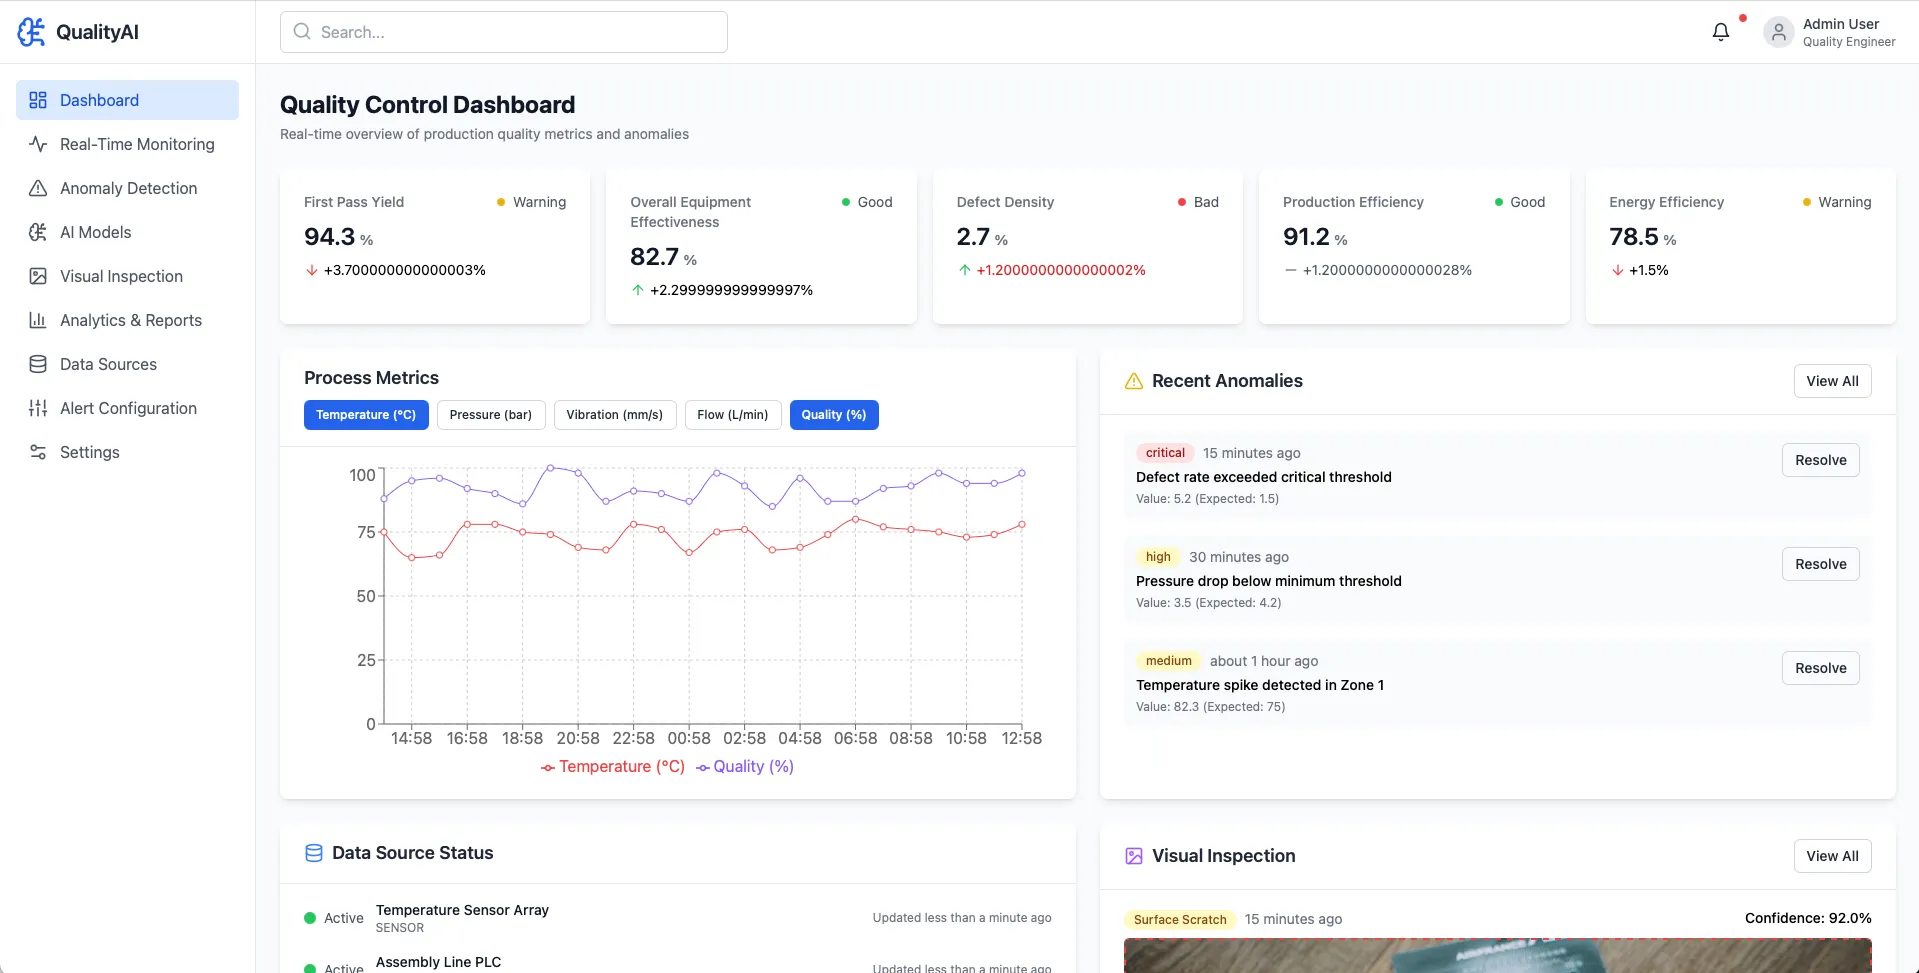
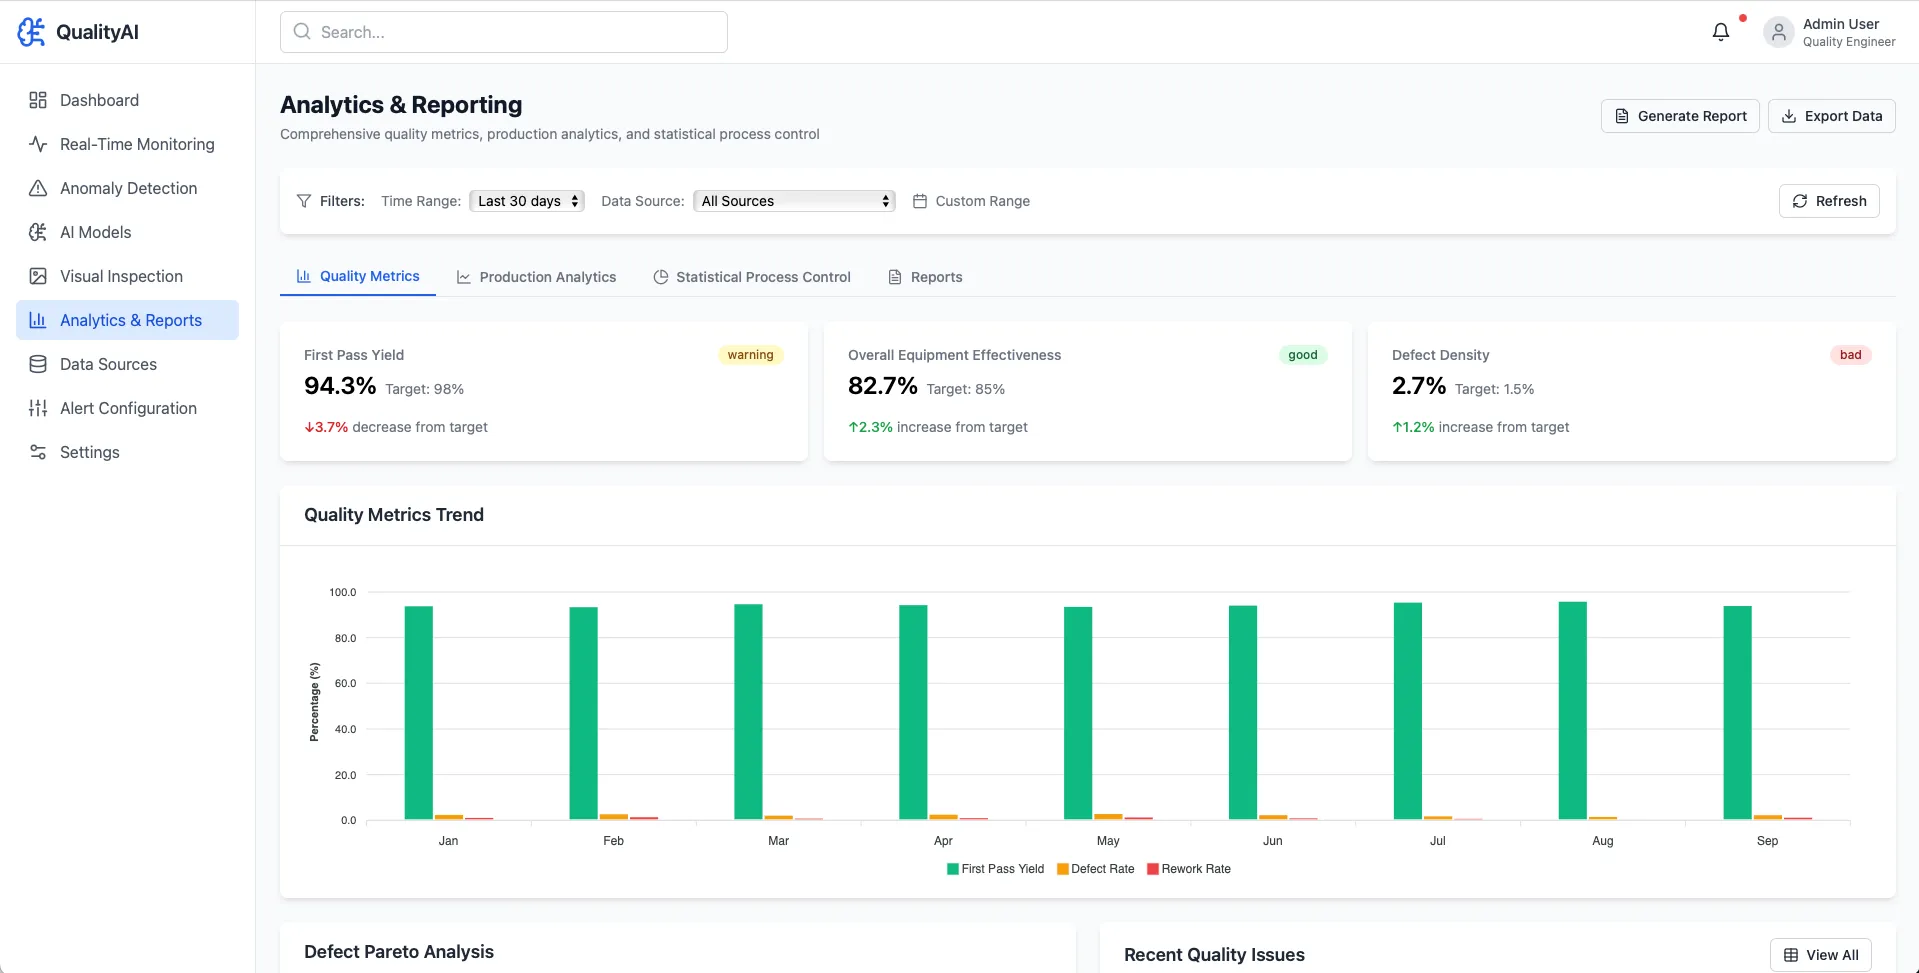
- Real-time operational oversight - first pass yield, overall equipment effectiveness (OEE), and defect density.
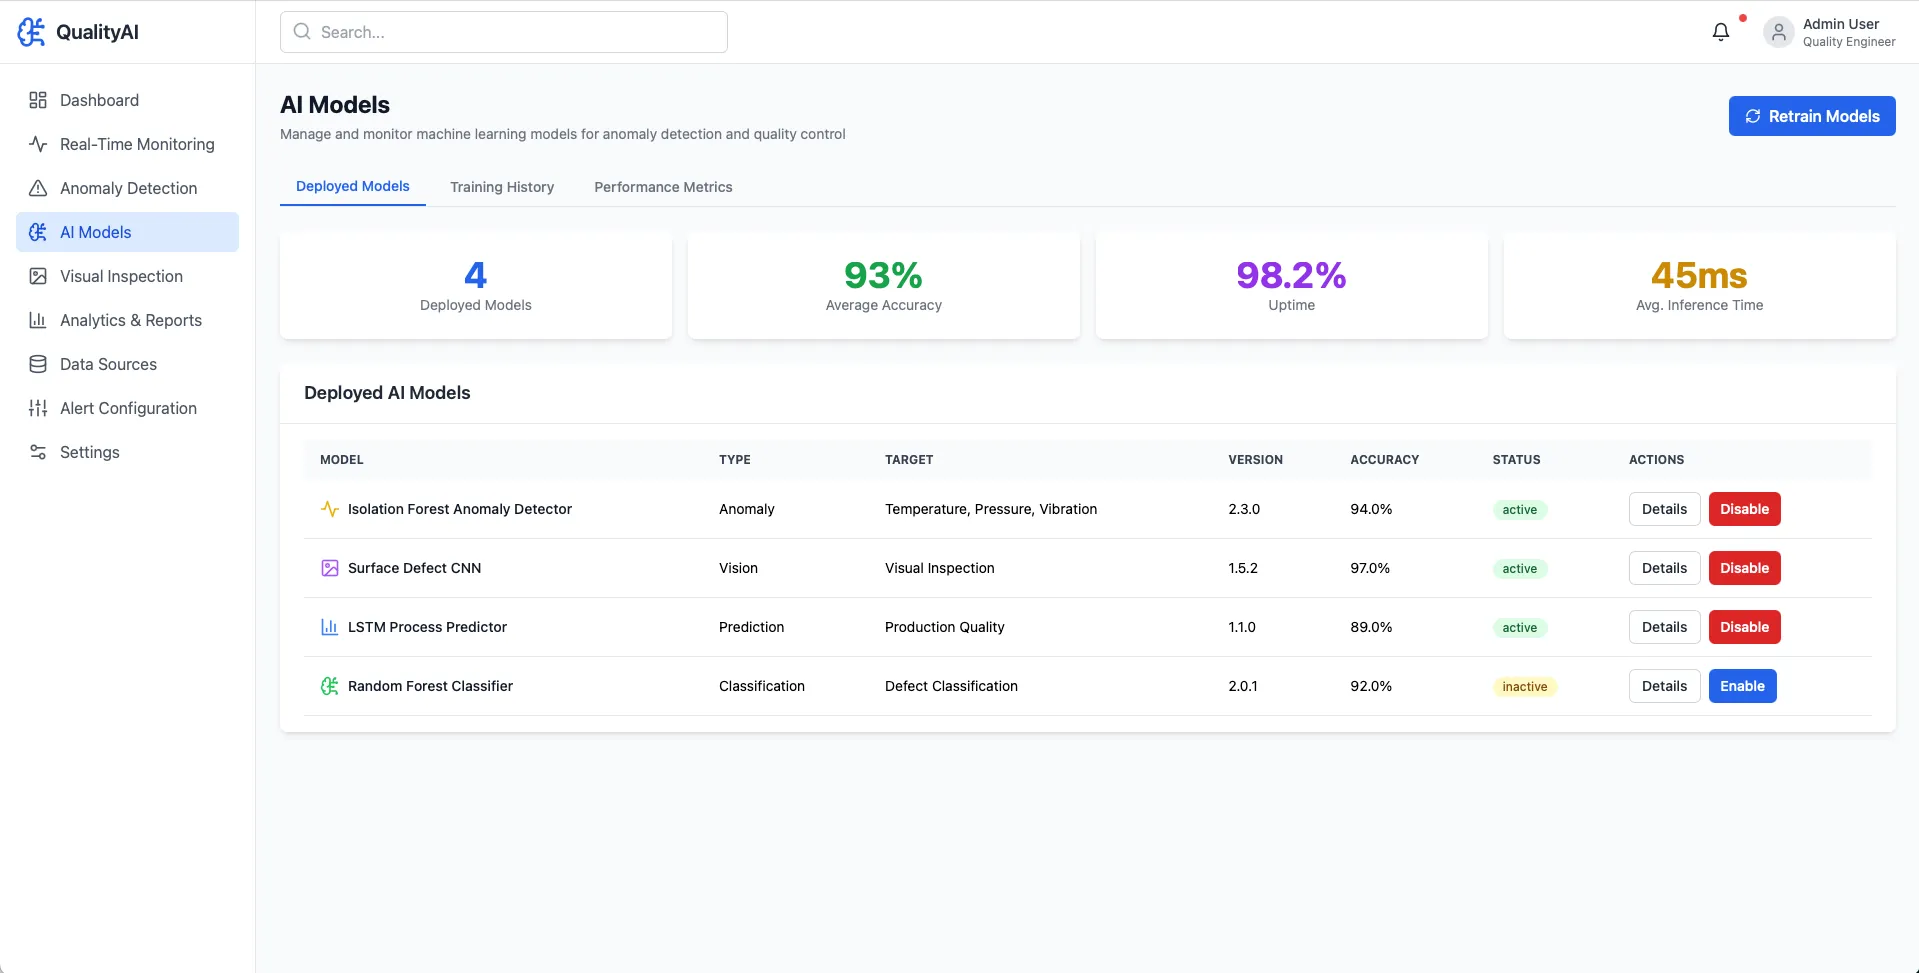
- Intelligent anomaly detection - AI continuously monitors process variables such as temperature, pressure, and vibration, replacing manual spot checks. Alerts trigger automatically when defect rates exceed critical thresholds, sensors report errors, or environmental spikes threaten product integrity.
- Automated visual inspection - a computer vision system identifies physical defects, such as surface scratches and dimensional errors, reducing human error and removing the inspection bottleneck on assembly lines.
- Connected from floor to front office - data comes together from operational technology (OT), including PLCs, SCADA systems, and sensor arrays, and information technology (IT), including manufacturing execution systems (MES) and ERP software.

No items found.
