< Back
Supply Chain Operations
Get end-to-end visibility across suppliers, logistics, warehouses, and customers, with AI demand forecasting and alerts that surface supply chain problems before they affect delivery.

Overview
Supply Chain Operations, built with IRIS Forge on the IRIS Foundry platform, gives supply chain managers end-to-end visibility and control across suppliers, production sites, warehouses, and customers, with AI-driven forecasting and alerts that surface problems before they affect delivery.
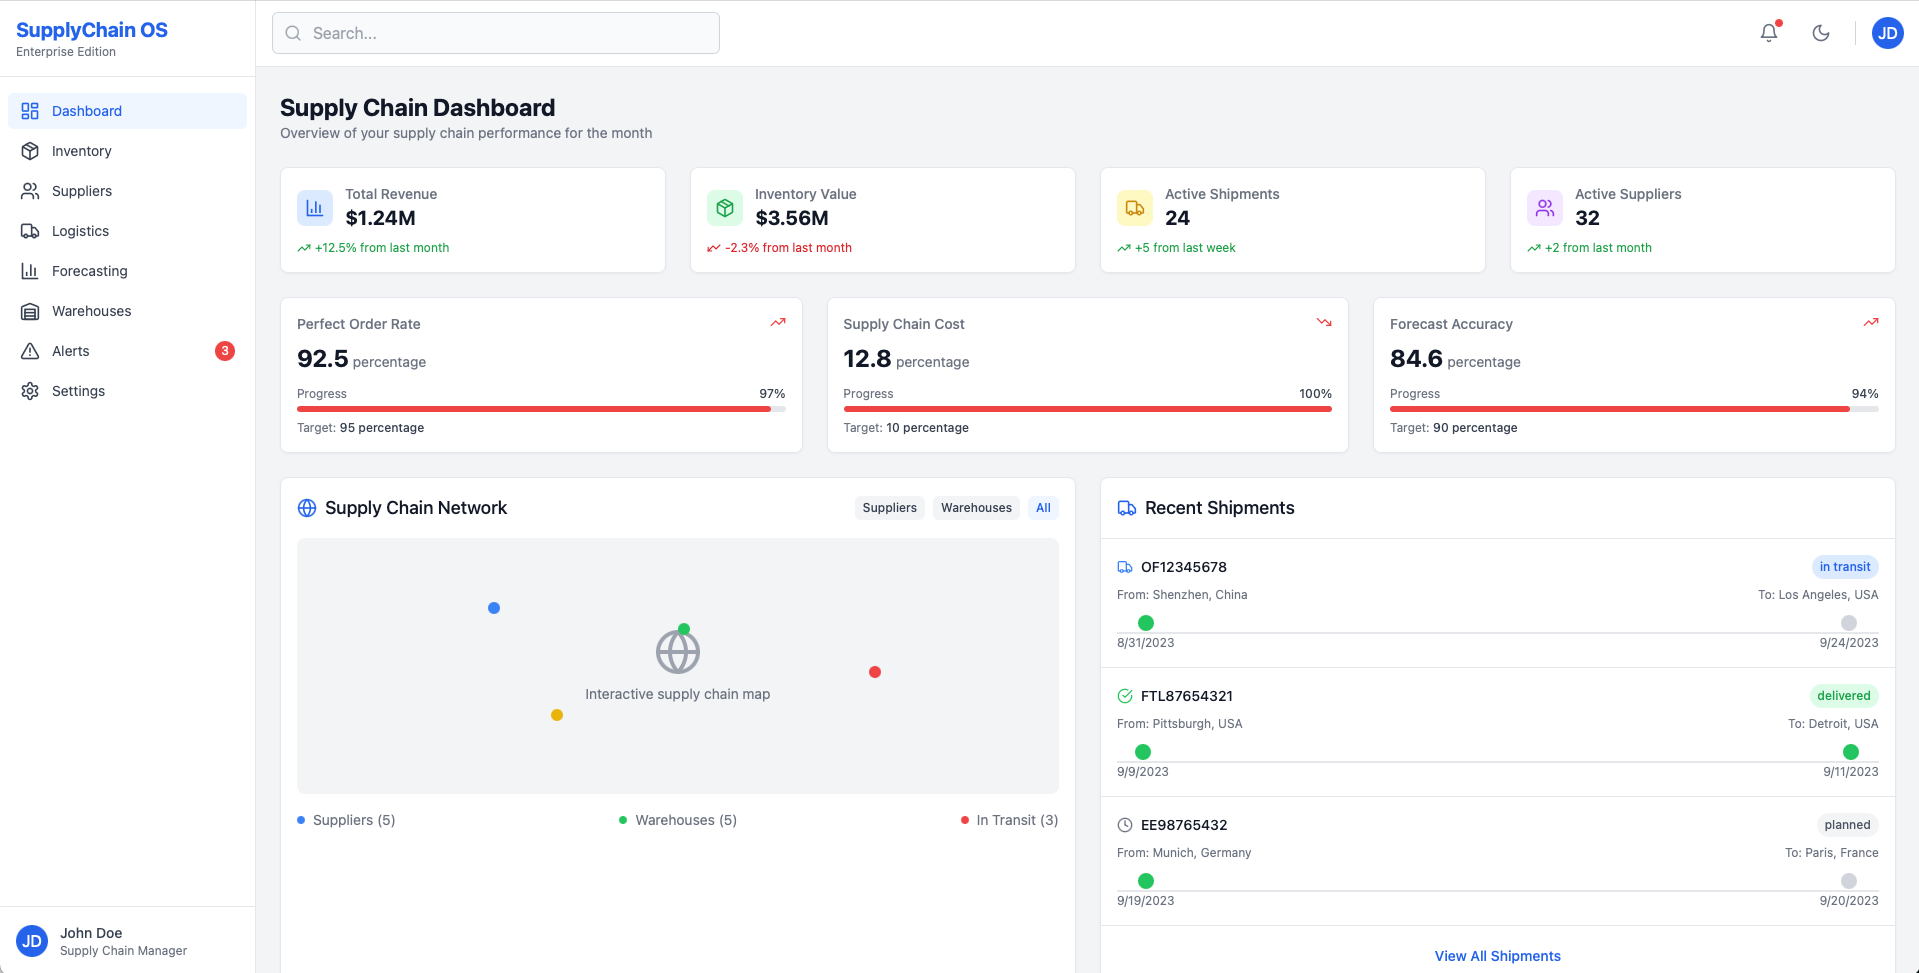
- Supply chain dashboard - revenue, inventory value, active shipments, and active suppliers in one view, with perfect order rate, supply chain cost, and forecast accuracy tracked against target.
- Network map and shipment tracking - an interactive map of suppliers, warehouses, and goods in transit, with every shipment tracked from origin to destination as planned, in transit, or delivered.
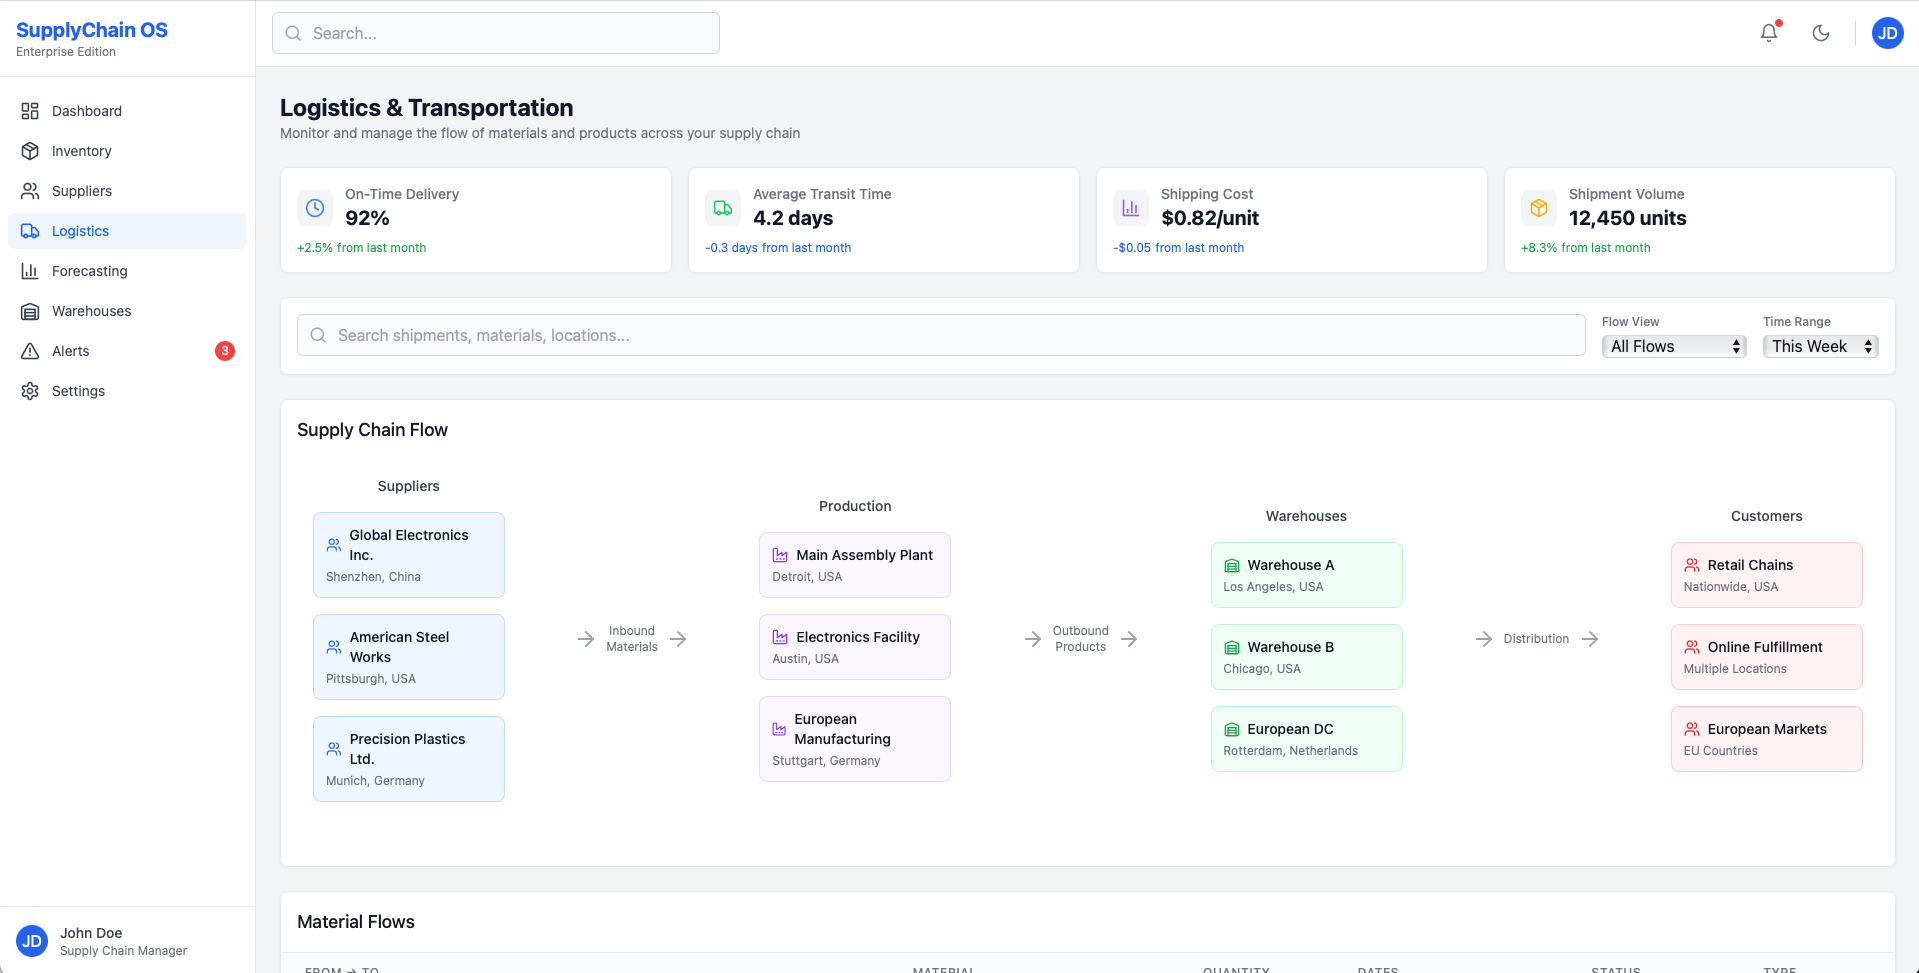
- Logistics and transportation - on-time delivery, transit time, shipping cost per unit, and shipment volume, plus an end-to-end flow view from suppliers through production and warehouses to customers.
- AI-driven demand forecasting - demand forecasts with confidence intervals, product-level forecasts, and forecast versus capacity, with a scenario mode for testing plans across different time horizons.
- Multi-location warehouse management - capacity and space utilization, inventory, workforce productivity, automated guided vehicles (AGVs), picking accuracy, order fulfillment time, and inventory turnover for each site.
- Inventory and supplier management - dedicated views for stock levels and supplier performance across the network, connected to data from across your systems.
- Alerts and notifications - stockout risks, shipment delays, supplier quality issues, warehouse capacity warnings, and forecast deviations ranked by severity, with acknowledge and resolve actions so nothing slips through.



No items found.
