Case study

Automating SOPs

7.13.2023
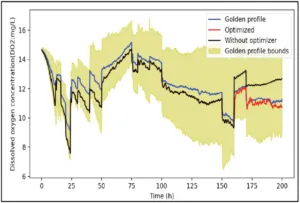
Line graph showing dissolved oxygen concentration (DO2) in mg/L over time in hours. It compares four data series: Golden profile (blue line), Optimized (red line), Without optimizer (black line), and Golden profile bounds (yellow shaded area). The graph shows fluctuations in dissolved oxygen concentration from 0 to 200 hours, with the Golden profile bounds indicating a range around the Golden profile line. The Optimized and Without optimizer lines generally stay within or near the Golden profile bounds after about 150 hours.

Increasing safety and regulatory compliance

This customer was required to track and trace every step in a chemical manufacturing process. Their paper-based standard operating procedures (SOPs) were cumbersome to use, enforce and update. As a result, employees often resorted to memory or tribal knowledge. To solve their issue, the customer digitally transformed the production process portion of the SOPs into guided work using the SymphonyAI Industrial Platform.