Video

MLOps Studio Demo
4.30.2024
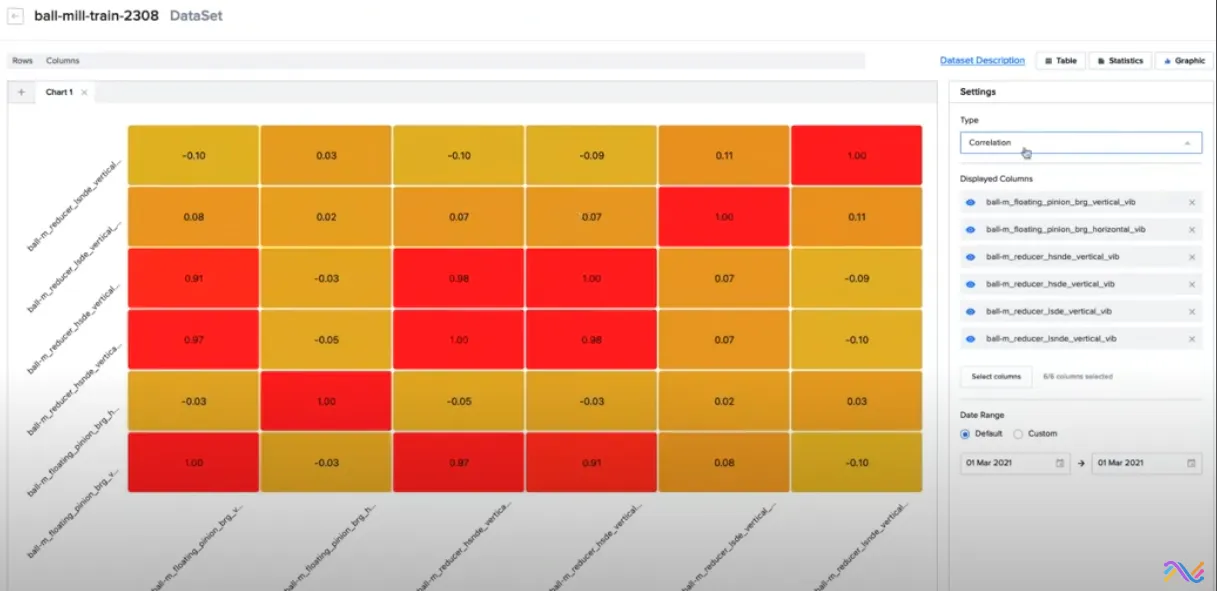
Heatmap showing correlation coefficients between six vibration-related variables labeled with 'ball-m' prefixes, with values ranging from -0.10 to 1.00. The color gradient ranges from orange to red, indicating strength of correlation. The settings panel on the right shows 'Correlation' selected as the type, six columns displayed, and a default date range of March 1, 2021. The heatmap cells show strong positive correlations near 1.00 in red and weaker or slightly negative correlations in orange.

MLOps Studio simplifies building, deploying, and scaling AI models.
Learn more: https://www.symphonyai.com/industrial/mlops/