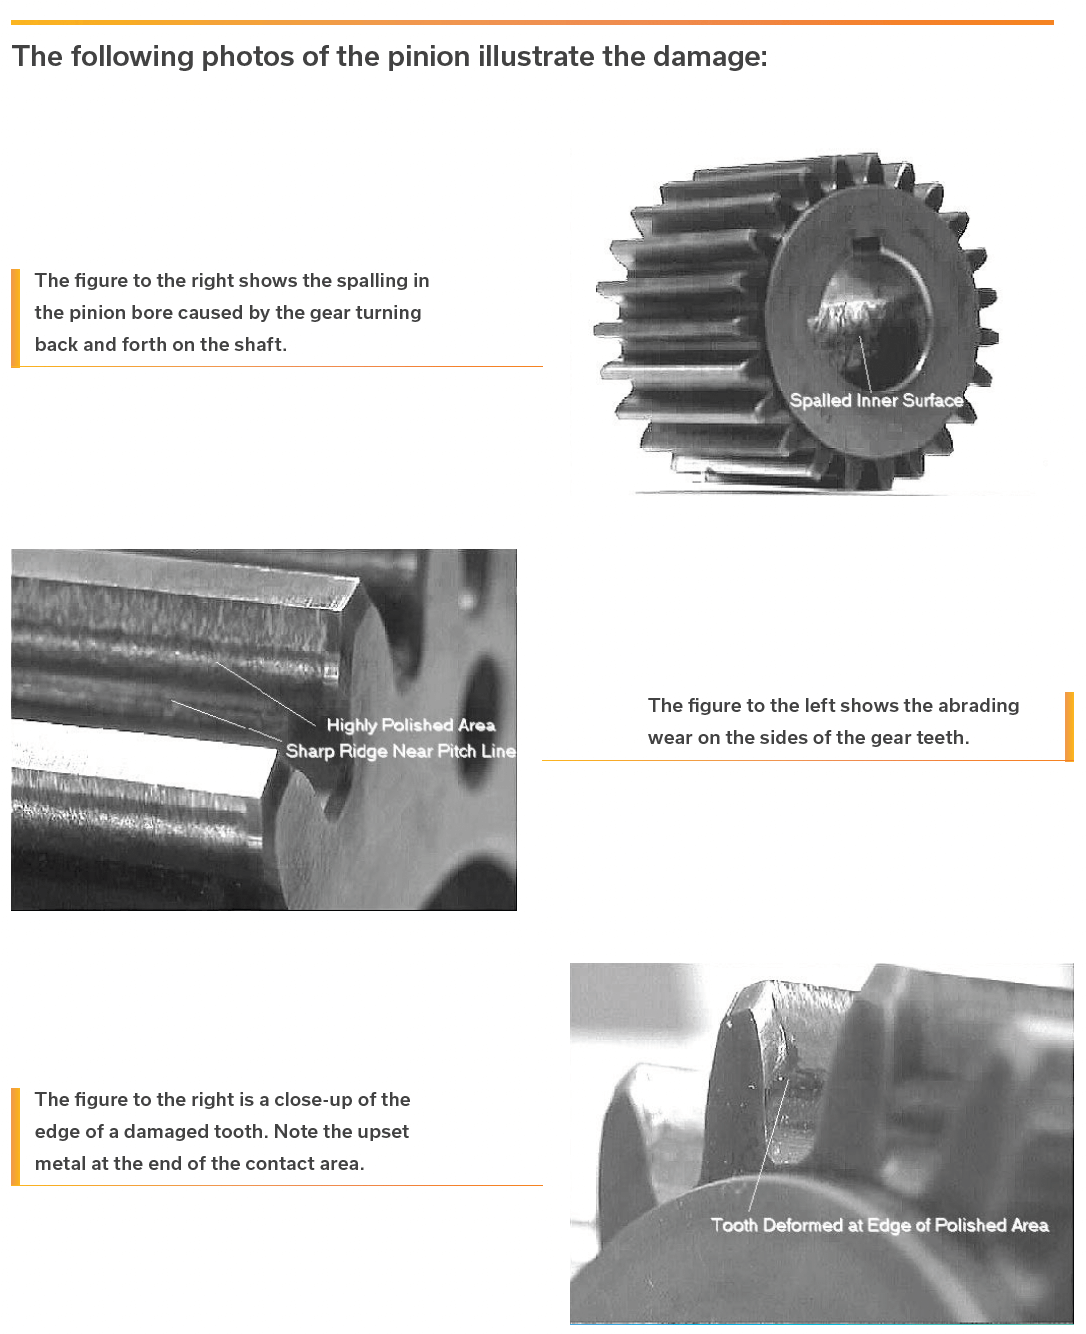
Diagnosing a low-speed gearbox problem

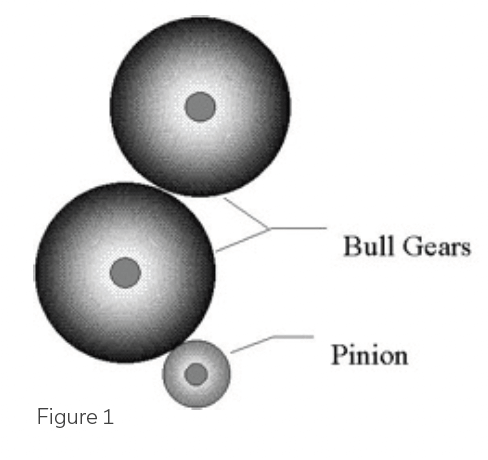
SymphonyAI Industrial was called on to help in the diagnosis of a suspected gearbox problem in a large plant connected with the paper industry. The gearbox in question had an input shaft with a 23-tooth pinion driving a large bull gear with 132 teeth which in turn drives another bull gear of the same size. The two gears are connected to large steel rollers about 24 inches in diameter. The two output gears turn at 52 RPM and the pinion turns at 302 RPM.
See figure 1 below:
The lubricating oil in the gearbox was regularly subjected to analysis, and the last report stated that there were iron particles in the oil. The maintenance supervisor asked if we could determine the source of the oil contamination, and the first thing we did was to examine the vibration spectra measured near the bearings. The spectra looked normal, without evidence of bearing tones, so we suspected that the metal was coming from one or more of the gears. See figure 2, below. The problem then became to identify the faulty gear (if any), so as to allow the maintenance effort to proceed without delay.

Synchronous averaging of time domain signals has been around for a long time, but have not been used nearly enough for machine problem diagnosis. SymphonyAI Industrial performed synchronous averaging of the gearbox vibration signature.
This involves the use of a tachometer-derived synchronizing trigger in the vibration analyzer to collect of series of waveform samples that are averaged together. The important part of this is that the beginning of each time record must occur at exactly the same time in the rotation of the gear in question.
This allows the entire vibration signal that comes from the gear to be emphasized in the time domain average, and all the vibration components from the other gears, shaft rpm, and bearing tones, etc. to be averaged out. This produces a time waveform that shows the individual teeth on the gear, with very little contamination from other components from the machine. When doing synchronous averaging, the analysis parameters of the analyzer are adjusted so the time record length spans a little more time than one revolution on the gear. This is easily accomplished since the time record length (T) is the reciprocal of the FFT line spacing (DF) in the spectrum. It is simply a matter of choosing a frequency span and number of lines so 1/DF is longer than 1 divided by the gear speed in Hz. Of course, it is possible to look at the spectrum taken from a synchronized waveform, but we did not bother to do this since the waveform provided the needed information.
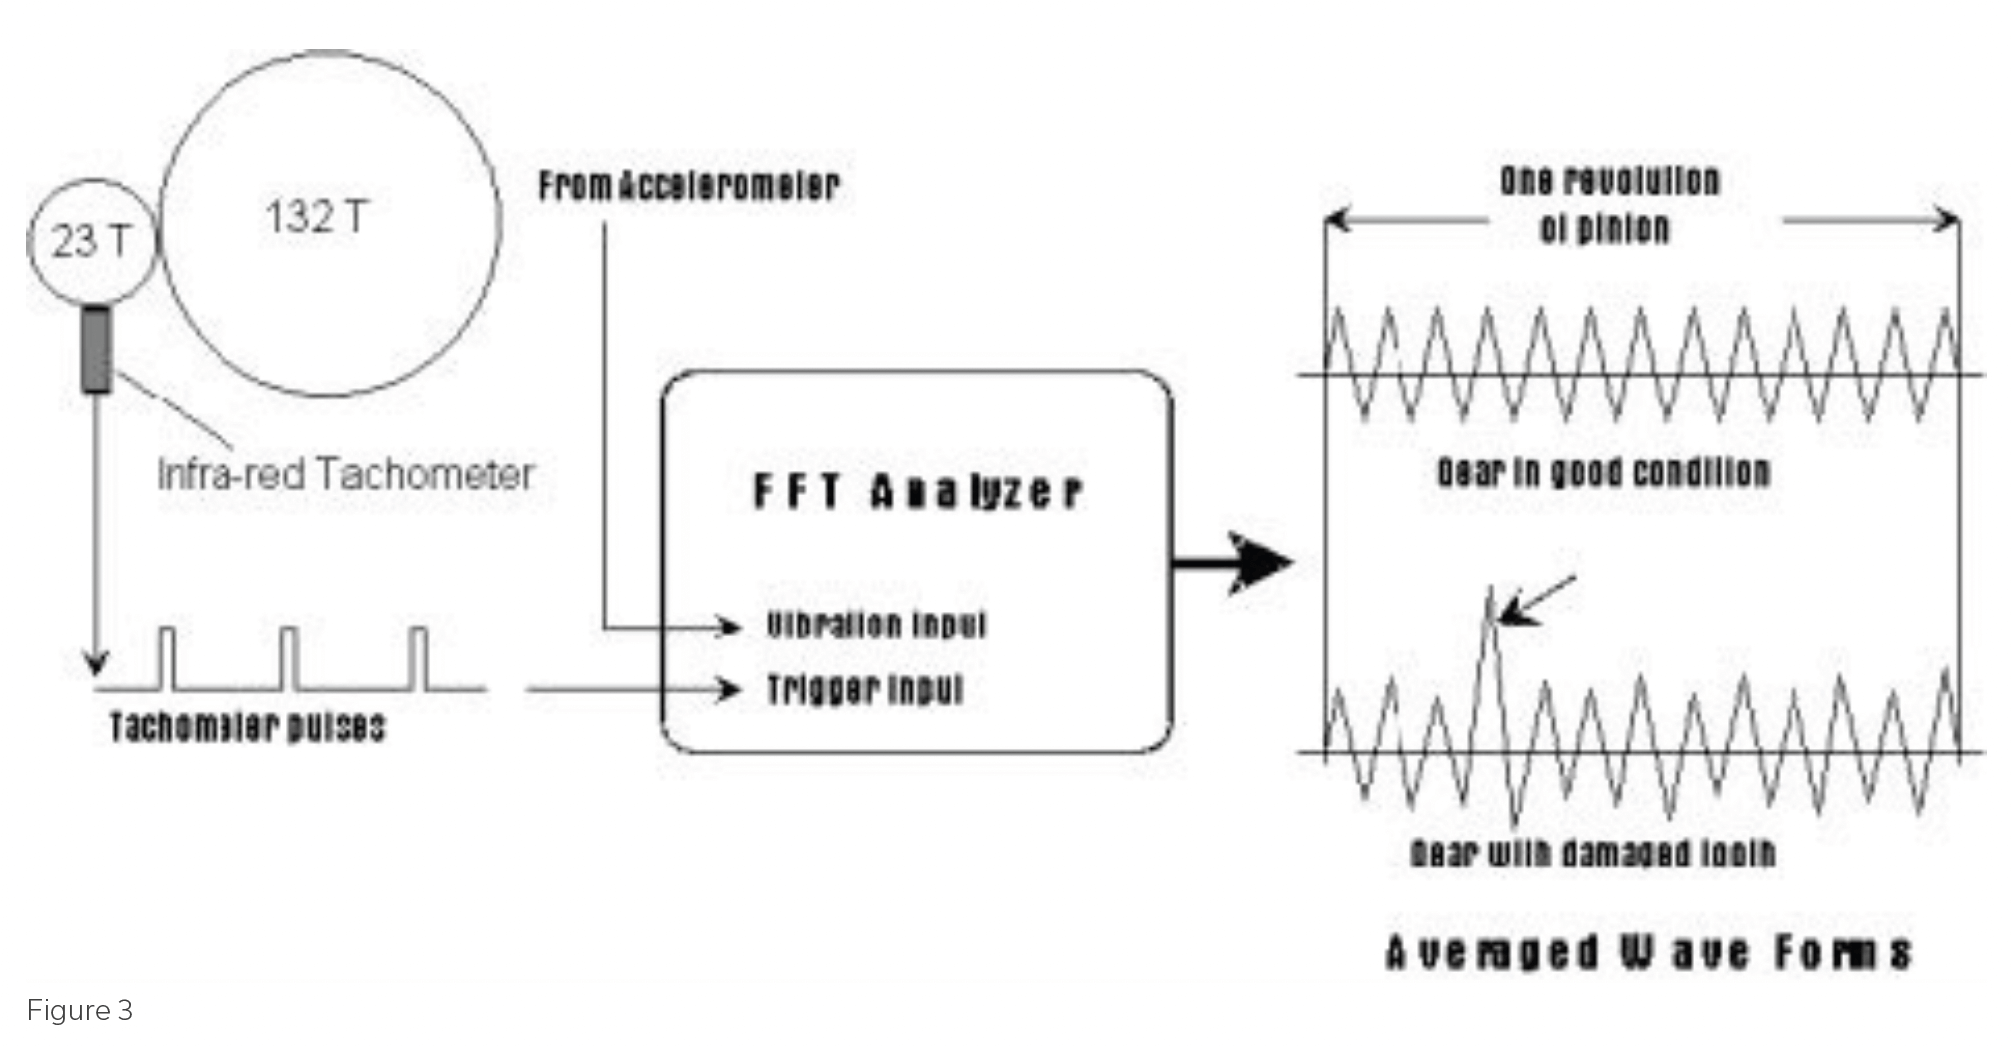
When using synchronous averaging, the number of averages used must be quite large; usually in the vicinity of 100 or so. For the tests described here, we used 90 averages. See figure 3 below for the setup details:
In many cases of synchronous averaging, the time record is much more interesting that the spectrum, since the spectrum contains no time information, and the time domain shows any irregularities in the gear meshing. In this case, all the spectra were unremarkable, simply showing the gear mesh frequency and some harmonics.
When we did synchronous averaging on each of the two bull gears, there was no indication of any defect in the waveform. But, when we performed the same test on the pinion, the waveform told another story. There was an obvious area on the gear where the meshing with the bull gear was very noisy and non-uniform. See figure 4 below: